
Fig. 6. Drp1-HK1 axis induces NLRP3 inflammasome activation in OLs of AD.
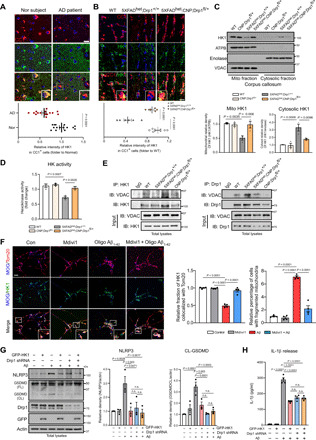
(A) Postmortem cortex sections from normal subjects and AD patients (Table 1) were stained with anti-HK1 and anti-CC1 antibodies. Scale bar, 20 μm. The HK1 intensity in CC1+ OLs was quantified. (B) Brain sections from mice of the indicated genotypes were stained with anti-HK1 and anti-CC1 antibodies. Scale bar, 20 μm. The HK1 intensity in CC1+ OLs of mice was quantified. n = 3 mice per group. (C) The corpus callosum was harvested from 6-month-old mice. Western blot analysis of mitochondrial and cytosolic fractions was performed. The HK1 density on mitochondrial and cytosolic fractions was quantified. n = 3 mice per group. ATPB, a mitochondrial inner membrane protein. Enolase, a cytosolic protein. VDAC, a mitochondrial outer membrane protein. (D) HK1 activity was measured using protein lysates harvested from mouse corpus callosum. n = 3 mice per group. (E) The corpus callosum was harvested from 6-month-old mice. Immunoprecipitation with anti-HK1 or anti-Drp1 was carried out. n = 3 mice per group. (F) Mature OLs were treated with Mdivi-1 (5 μM) 4 hours followed by the addition of oligomeric Aβ1-42 (5 μM). After 24 hours, cells were stained with anti-Tom20, anti-HK1, and anti-MOG antibodies. Left: Representative images from three independent experiments. Right: Percentage of mitochondrial HK1 density out of total HK1 density in MOG+ cells and percentage of MOG+ cells with fragmented mitochondria. Scale bar, 20 μm. (G) Mature OLs were infected with Drp1 shRNA followed by overexpression of GFP-HK1 for 48 hours, and cells were treated with oligomeric Aβ1-42 (5 μM) for 24 hours. Western blot analysis was performed. n.s., not significant. The densities of NLRP3 and cleaved GSDMD relative to actin are shown in histograms. (H) The release of IL-1β was analyzed by ELISA. All the data are expressed as the mean ± SEM and compared by one-way ANOVA with Tukey’s post hoc test.