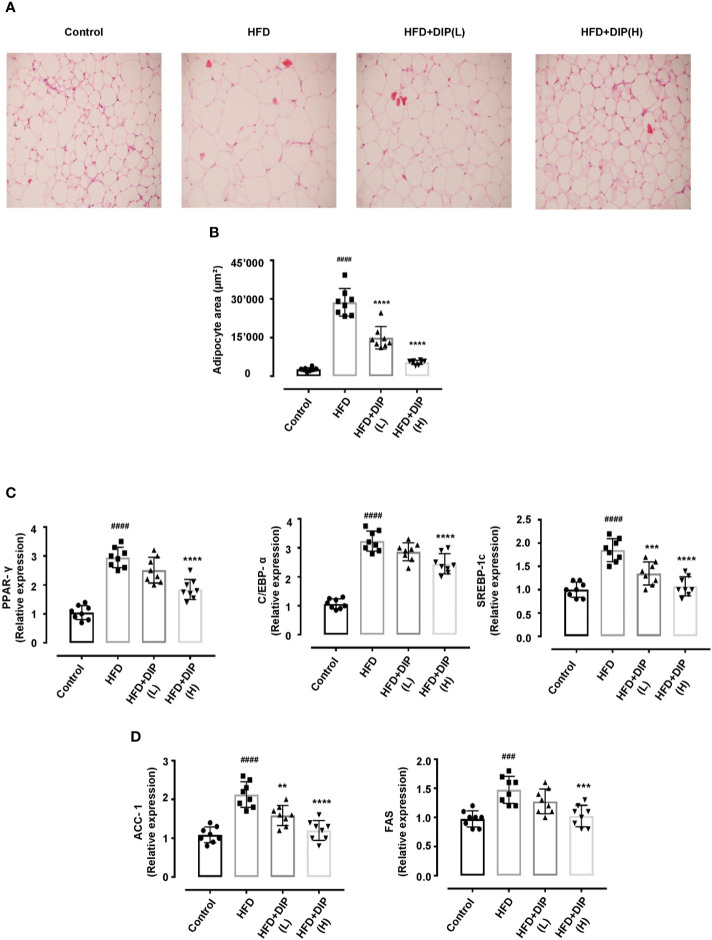
Figure 3.
Histologic analysis and lipogenic gene expression of epididymal adipose tissue in HFD-induced obese mice. Adipocyte structural analysis and size estimation through H&E staining and ImageJ software. Scale bar, 50 μm. (A) The differences in the histology of adipocytes in various treatment groups are evident in representative H&E stained images. (B) The distribution of adipocytes area indicates HFD has greater adipocytes area (>20,000 μm2). On the contrary, DIP treated groups revealed smaller adipocytes size (<20,000 μm2). Data are expressed as the mean ± SEM, (n = 8) in each group based on one-way ANOVA Tukey post hoc analysis. Significant differences were identified at ####p < 0.0001, HFD group vs control group, and ****p < 0.0001, HFD group vs HFD + DIP(L) and HFD + DIP(H) groups. (C) Effect of DIP supplementation treatment on the adipogenic genes expression PPAR-γ, C/EBPα, and SREBP-1c in adipose tissues was determined with qRT-PCR. (D) Effect of DIP supplementation treatment on the lipogenic gene expression ACC-1, and FAS in adipose tissues was determined with qRT-PCR. The data is expressed as mean ± SEM (n = 8) based on one-way ANOVA Tukey post hoc analysis. Significant differences were identified at ###p < 0.001, ####p < 0.0001, HFD group vs control group; **p < 0.01, ***p < 0.001 and ****p < 0.0001, HFD group vs HFD + DIP(L) group or HFD group vs HFD + DIP(H) group.

