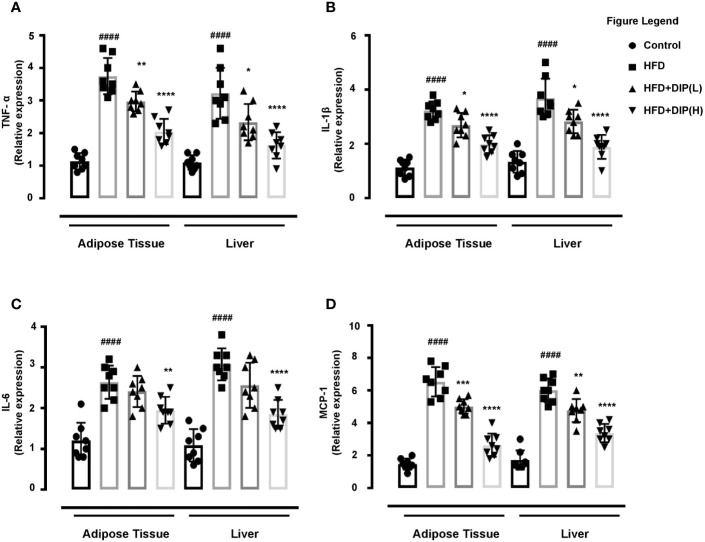
Figure 7.
Effect of DIP on adipokine expression in epididymal adipose tissue and liver. The relative mRNA expression of (A) TNF-α (B), IL-6, (C) IL-1β, and (D) MCP-1 expression levels in the epididymal adipose tissue and hepatic tissue were analyzed with qPCR. The data is expressed as mean ± SEM (n = 8) based on one-way ANOVA Tukey post hoc analysis. Significant differences were identified at ####p < 0.0001, HFD group vs control group; *p < 0.05, **p < 0.01, ***p < 0.001 and ****p < 0.0001, HFD group vs HFD + DIP(L) group or HFD group vs HFD + DIP(H) group.

