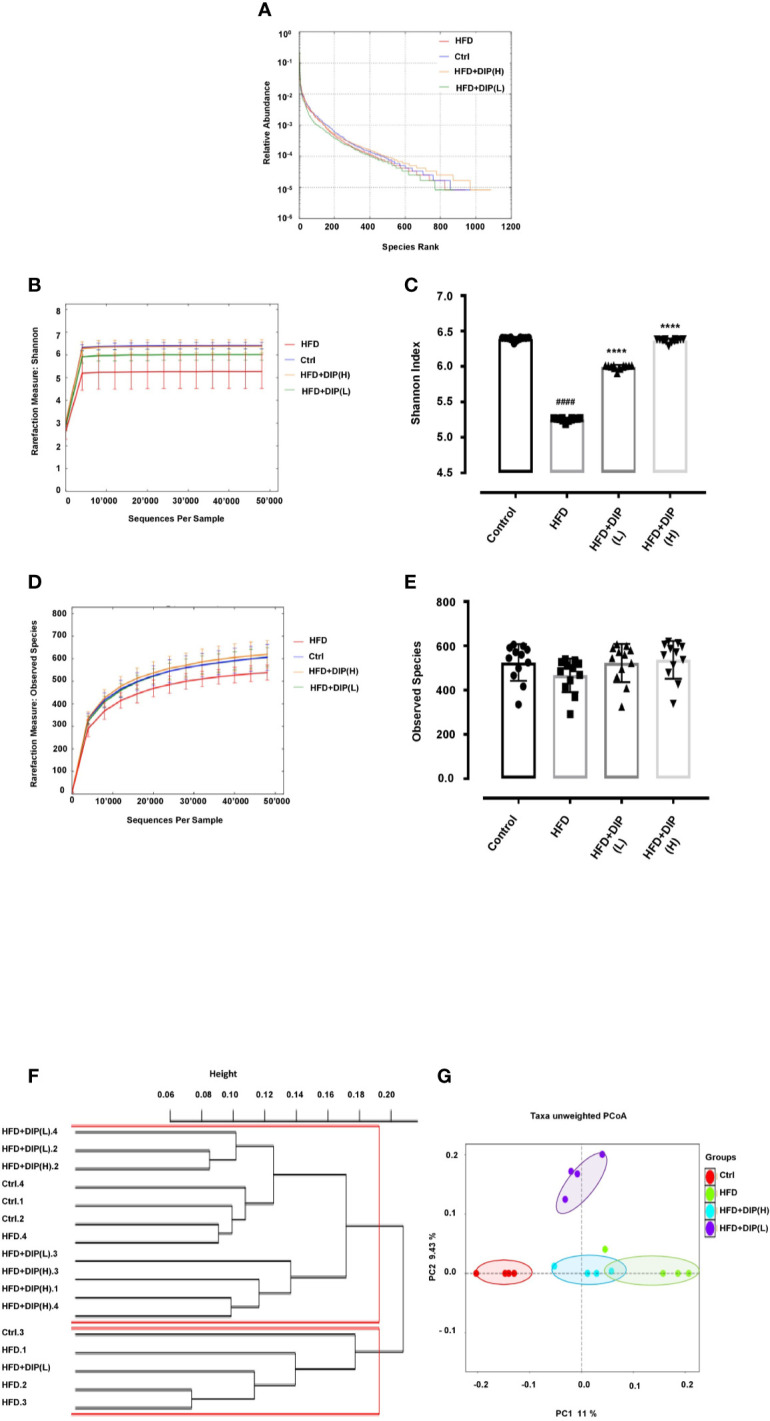
Figure 8.

Impact of DIP on gut microbiota diversity and abundance in HFD mice. (A) Rank abundance curve, (B) Shannon index, (C) bar graph for Shannon index, (D) observed species, (E) bar graph for observed species showing species diversity, richness, and abundance. (F) Cluster dendrogram and (G) principal coordinate analysis (PCoA) representing the level of similarities or dissimilarities among different treatment groups (n = 4). The data is presented as the mean ± SEM, (n = 4) using one-way ANOVA followed by the Tukey post hoc test. Significant differences were identified at ####p < 0.0001, HFD group vs control group; ****p < 0.0001, HFD group vs HFD + DIP(L) group or HFD group vs HFD + DIP(H) group. The clustering of PCoA analysis is statistically supported by the one-way ANOVA using ANOSIM test (R = 0.4722, p = 0.002).
