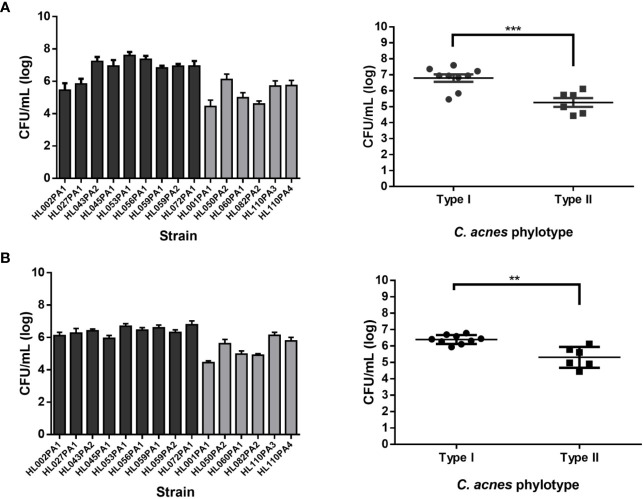
Figure 1.
Left graphs show results per strain (black bars: phylotype I, grey bars: phylotype II) while right graphs show results grouped per phylotype. (A) Bacterial association with SZ95 sebocytes expressed as CFU/mL (log scale). (B) Bacterial association with HaCaT keratinocytes expressed as CFU/mL (log scale). Data shown are mean from at least five biological replicates, error bars indicate SEM. **p < 0.01, ***p < 0.005.

