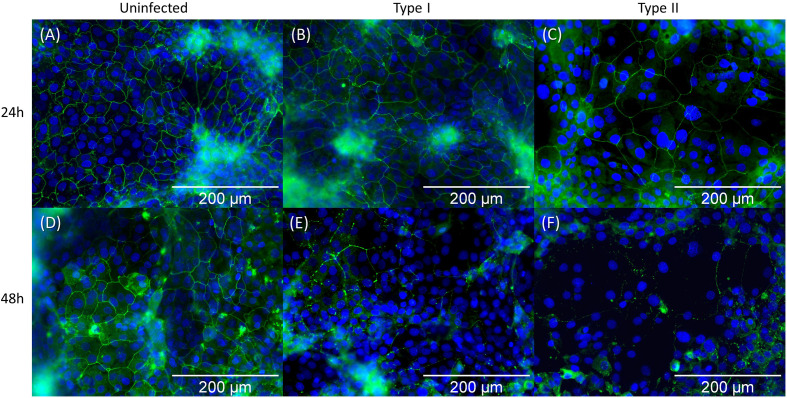
Figure 3.
Immunocytochemistry staining of the ZO-1 tight junction protein of HaCaT keratinocytes followed by fluorescence microscopy. ZO-1 tight junction proteins and the cell nuclei (DAPI) are visualized in green and blue respectively. Pictures (A–C) represent the state after 24 h infection: (A) uninfected control, (B) infected with HL053PA1 (type I strain), and (C) infected with HL110PA3 (type II strain). Pictures (D–F) show the remains of ZO-1 protein after 48 h infection: (D) uninfected control, (E) infected with HL053PA1, and (F) infected with HL110PA3. Total magnification: 599x. Scale bars: 200 µm.

