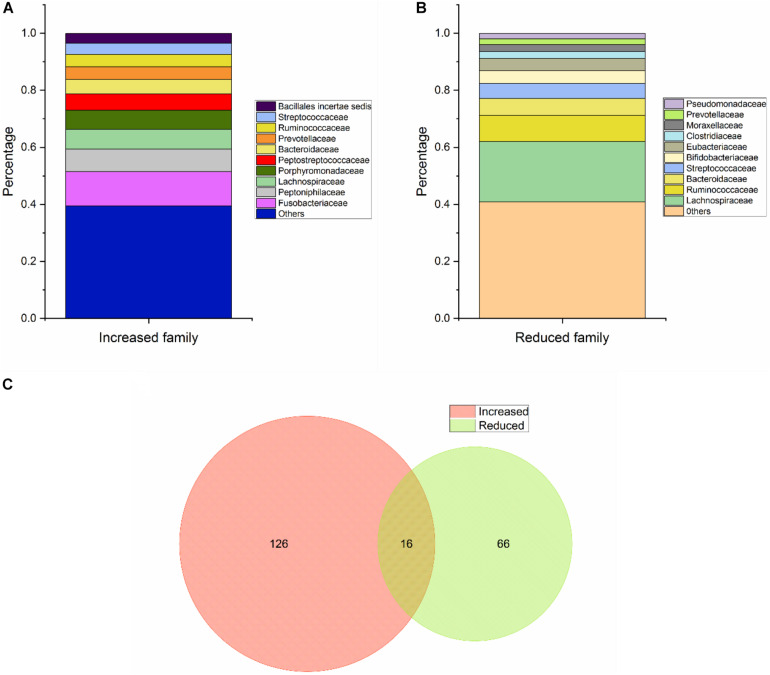
FIGURE 3.
Basic statistical analysis of Class Two microbes (shown to be significant via high-throughput sequencing/pyrosequencing or qPCR) in the database. (A) Statistical analysis of the top 10 increased microbes at the family level. (B) Statistical analysis of the top 10 reduced microbes at the family level. (C) Venn diagram of all CRC-associated microbes at the species level.

