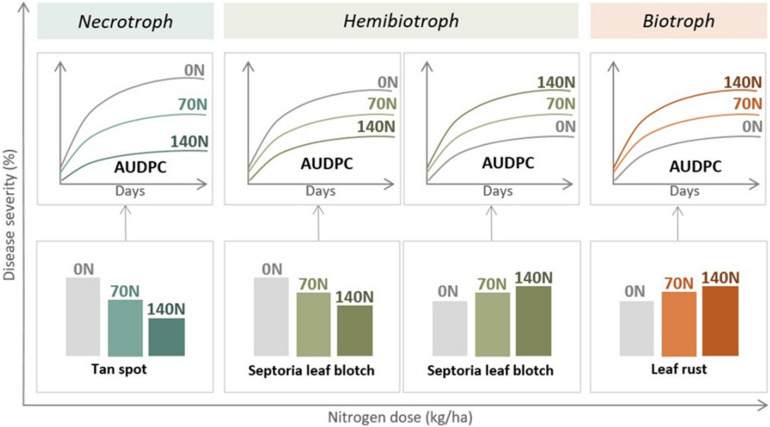
FIGURE 3.
General diagram of the effect of nitrogen fertilization on three main foliar diseases of wheat in the same inoculated experiments. The nutritional habit of each pathogen causing disease is also indicated (AUDPC, area under disease progress curve; N, kg nitrogen/ha). Data indicated the most common response for biotroph and necrotroph pathogens and the different possible responses for hemibiotrophs.

