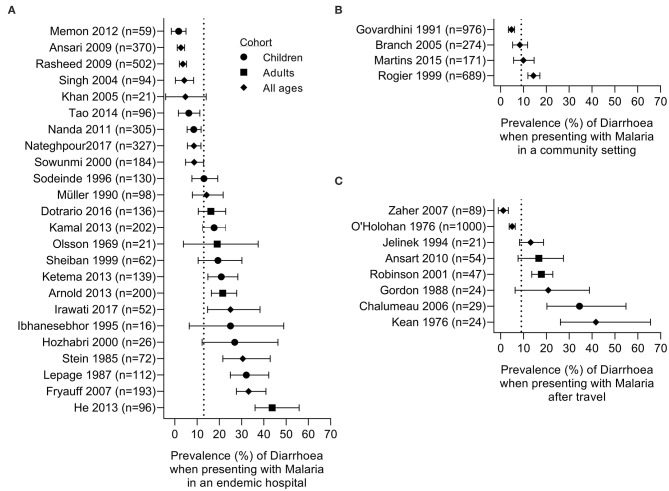
Figure 2.
Prevalence of diarrhoea in subjects with malaria. Studies are grouped by setting: (A) patients seeking care in a hospital setting in an endemic area, (B) community survey; (C) malaria in travelers admitted to hospital on their return home. Dotted line represents the prevalence estimate from the combined data: (A) 13%, (B) 9%, and (C) 9%. Symbols denote the age of the studied cohort: children (circle), adults (square), or all ages (diamond).

