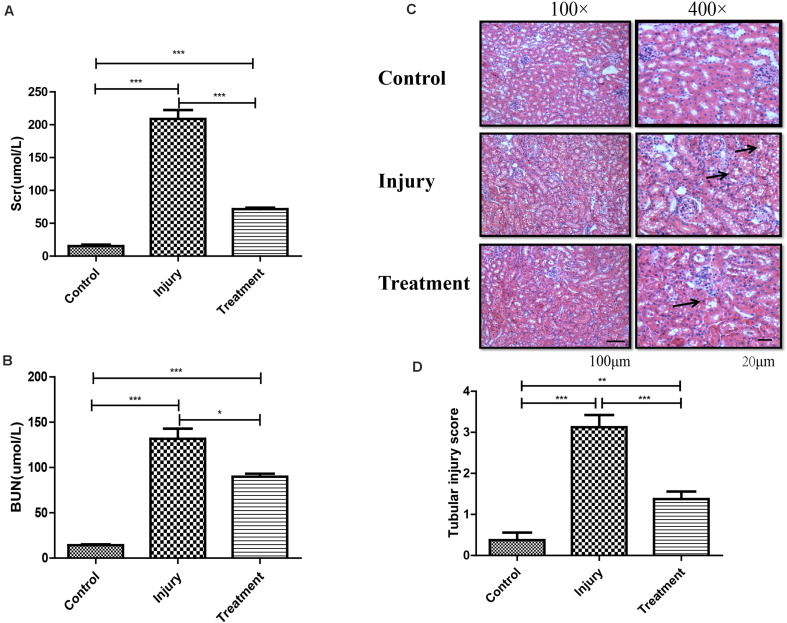
FIGURE 1.
Establishment of cisplatin-induced acute kidney injury model in C57 mouse. (A) Analysis of Scr level in mice following different treatments. Error bars represent the standard deviation. ***p < 0.001, Student’s t-test. (B) Analysis of BUN level in mice following different treatments. Error bars represent the standard deviation. *p < 0.05, ***p < 0.001, Student’s t-test. (C) Represents the image of hematoxylin and eosin staining in kidney (black arrows indicating the injury). (D) Score for characteristic histologic signs of renal injury. **p < 0.01, ***p < 0.001, Student’s t-test.

