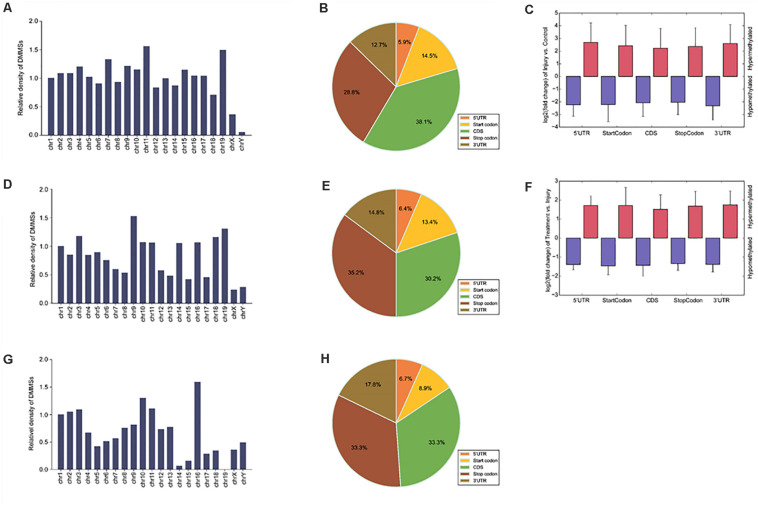
FIGURE 3.
Distribution of differentially methylated N6-methyladenosine sites. (A) Relative occupancy of differentially methylated m6A sites in each chromosome normalized by length in IvC. (B) Pie chart showing the percentage of DMM peaks in five non-overlapping segments in IvC. (C) Statistics of fold change of DMM peaks in five segments. The histogram shows the mean of the fold change in IvC. Error bars represent the standard error of the mean. (D) Relative occupancy of differentially methylated m6A sites in each chromosome normalized by length in TvI. (E) Pie chart showing the percentage of DMM peaks in five non-overlapping segments in TvI. (F) Statistics of fold change of DMM peaks in five segments. The histogram shows the mean of the fold change in TvI. Error bars represent the standard error of the mean. (G) Relative occupancy of differentially methylated m6A sites in each chromosome normalized by length. (H) Pie chart showing the percentage of DMM peaks in five non-overlapping segments.

