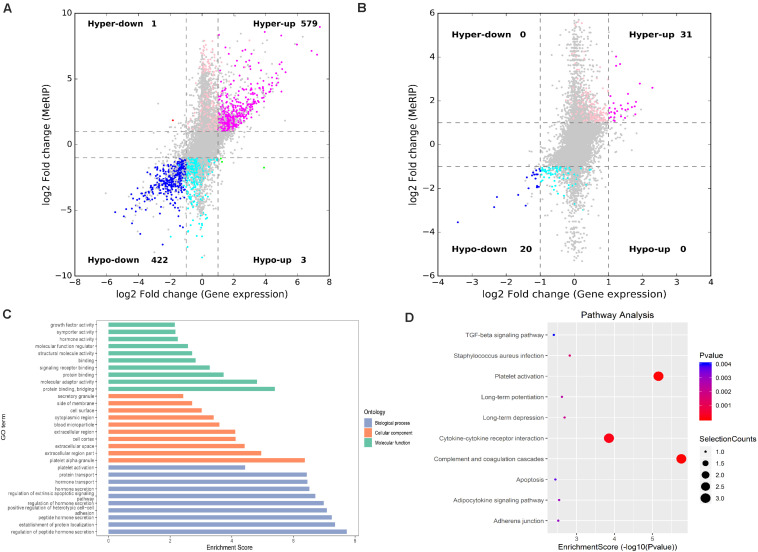
FIGURE 7.
Conjoint analysis of differentially methylated genes and differentially expressed genes. (A) Four-quadrant graph exhibiting the DEGs containing differentially methylated m6A peaks in IvC. (B) Four-quadrant graph exhibiting the DEGs containing differentially methylated m6A peaks in TvI. (C) Major gene ontology terms were significantly enriched for the genes containing m6A sites with reverse methylation and expression trends between IvC and TvI. (D) Major enriched pathways for the genes containing m6A sites with reverse methylation and expression trends between IvC and TvI.

