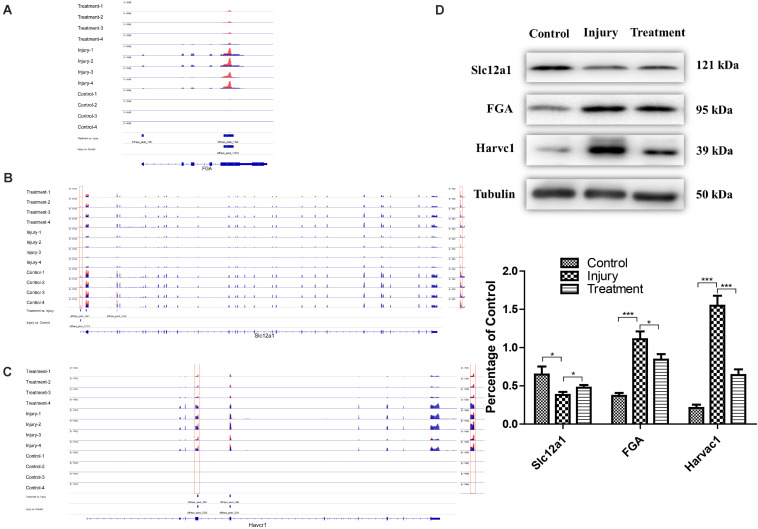
FIGURE 8.
Representative genes with opposite m6A methylation and expression trends between IvC and TvI. (A) Visualization of m6A-modified genes FGA in the control group, injury group, and treatment group. (B) Visualization of m6A modified genes Slc12a1 in the control group, injury group, and treatment group. (C) Visualization of m6A-modified genes Havcr1 in the control group, injury group, and treatment group. (D) Western blot images of FGA, Slc12a1, and Havcr1 in control group, injury group, and Havcr1 group. Error bars represent the standard deviation. *p < 0.05, ***p < 0.001, Student’s t-test.

