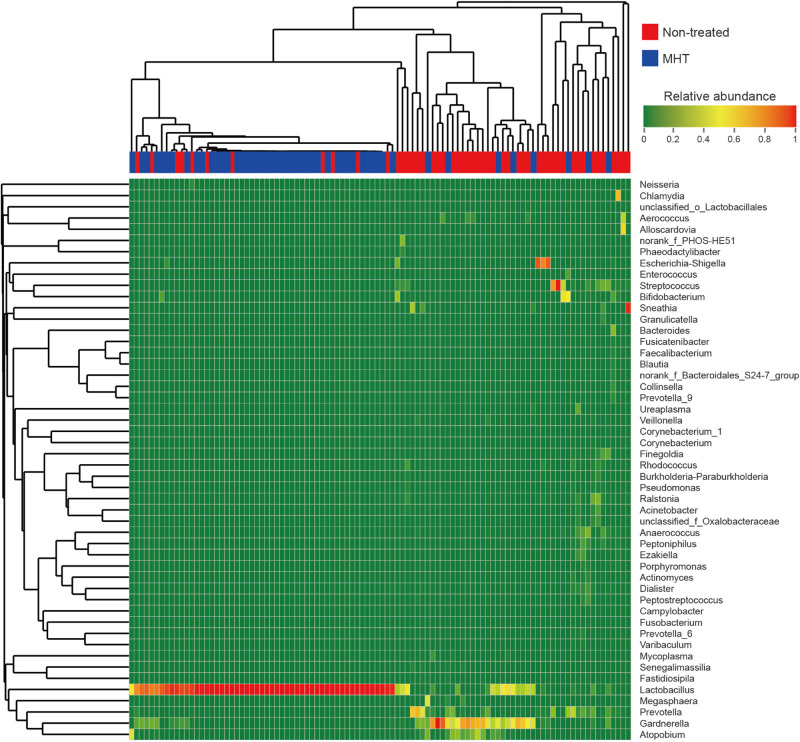
FIGURE 3.
Heatmap analysis of relative abundance of microbial taxa found in all vaginal samples at the genus level (top 50). Each sample is shown as vertical bar, and different color of each cell represents different relative abundance: the low abundance and high abundance are highlighted by green and red, respectively. The horizontal bar on the top indicates the non-treated (red) or MHT (blue) group; dendrograms reflect hierarchical clustering on Bray–Curtis dissimilarity (columns) or Euclidean distance (rows) using average linkage.

