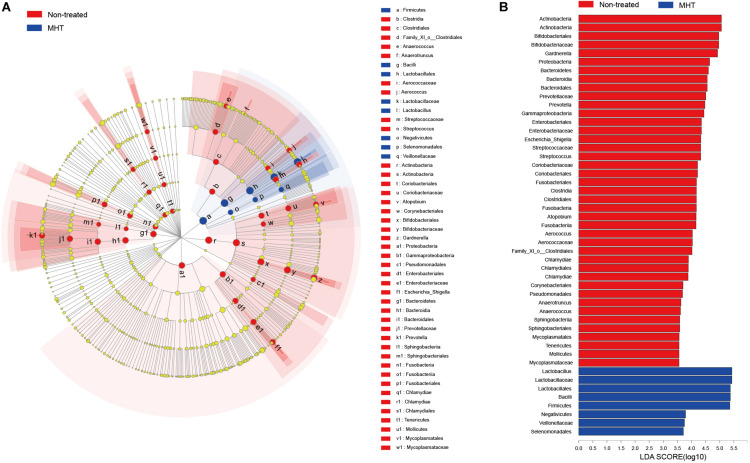
FIGURE 4.
Linear discriminant analysis (LDA) effect size (LEfSe) analysis for comparing microbial variations at the genus level between the non-treated (red) and MHT (blue) group. (A) LEfSE cladogram of microbial taxa in different group (P < 0.05). (B) LDA score identifying effect size of difference between groups with a threshold value of 3.5, a higher score represents a greater contribution to the observed intergroup difference, indicating this taxon is a more important biomarker.

