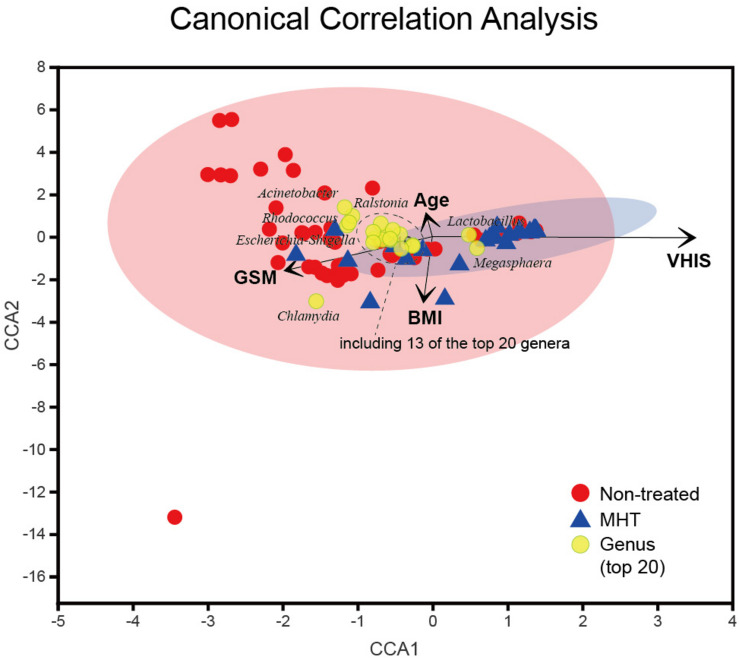
FIGURE 5.
Canonical correlation analysis (CCA) of the above vaginal microbiota and clinical characteristics. Red and blue points represent non-treated and MHT samples, respectively, the 95% confidence intervals of samples’ distribution are visualized by ellipses, and the top 20 microbial genera are colored with yellow. Clinical characteristic variables (age, BMI, VHIS, GSM) are indicated by vectors in black.

