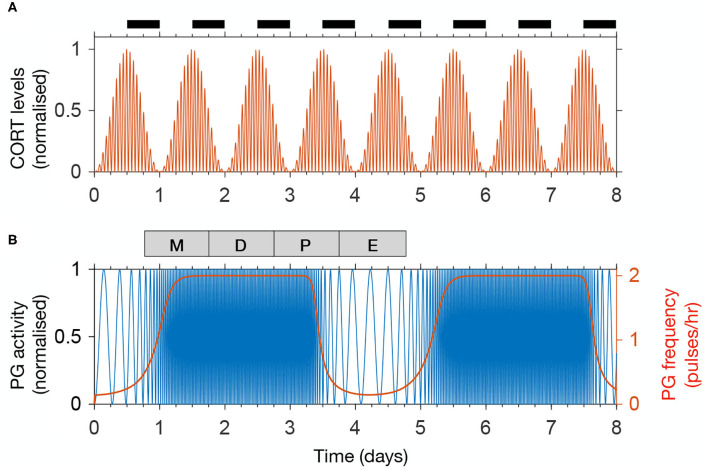
Figure 2.
The model reproduces physiological rhythms in the HPA and HPG axis. (A) Normalized CORT levels as a function of time. The light-dark cycle is represented with intermittent black bars on the top. (B) Normalized pulse generator activity (blue) and pulse generator frequency (red) as a function of time. The phases of the estrous cycle are marked on the top: estrus (E); metestrus (M); diestrus (D); and proestrus (P).

