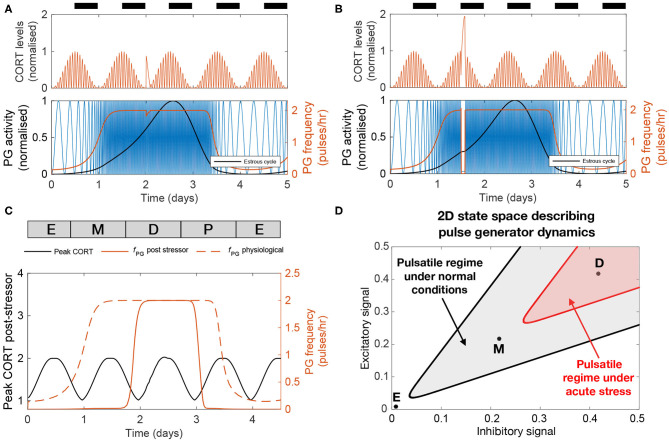
Figure 5.
The effect of acute stress on the dynamics of the HPA and HPG axes. (A,B) CORT levels and PG activity in response to a transient (2 h long) stressor initiated at two different times. (C) Peak CORT levels (black line) and mean PG frequency (continuous red line) elicited by a 2 h long acute stressor as a function of the time at which the stressor arrives during the estrous cycle. The PG frequency without any stress perturbation is shown for comparison (dashed red line). (D) State space diagram describing the effect of acute stress on the dynamics of the pulse generator. Points mark different stages along the estrus cycle: estrus midpoint (E); metestrus midpoint (M); and diestrus midpoint (D). The shaded gray area denotes the region of the state space corresponding to frequencies above 1 pulse/h under normal physiological conditions. Acute stress shrinks this region (red shaded area), but the dynamics of the pulse generator maintains robustness to perturbations during the diestrus phase.

