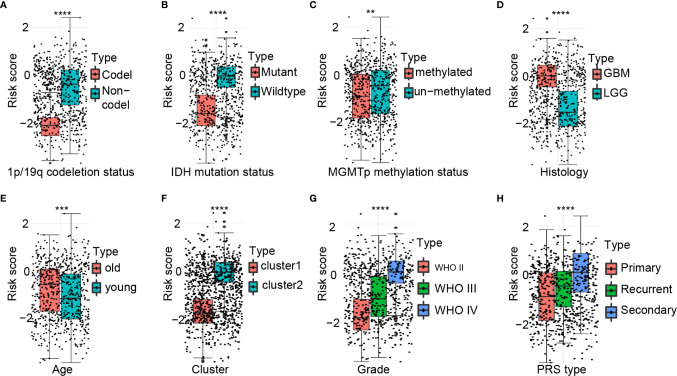
Figure 3.
Association between the ferroptosis-related signature and other pathological features in CGGA cohort. (A–H) Distribution of the risk score in patients stratified by 1p/19q status (A), IDH status (B), MGMT promoter methylation (C), Histology (D), Age (E), Cluster (F), WHO grade (G), and PRS type (H). ****P < 0.0001; ***P < 0.001; **P < 0.01.

