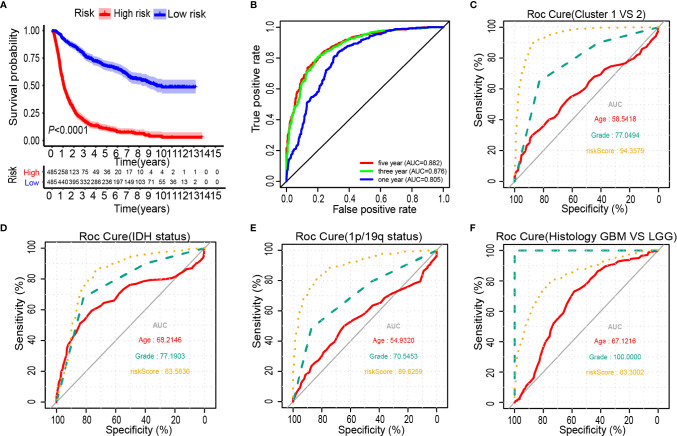
Figure 4.
Prognostic significance of the 25-gene signature derived risk scores in CGGA cohort. (A) Kaplan-Meier analysis of CGGA gliomas patients was stratified by median risk. (B–F) High-risk scores are associated with general poor survival of gliomas. ROC curves showed the predictive efficiency of the risk signature, overall survival (B), Cluster 1/2 subgroups (C), IDH status (D), 1p/19q status (E), and Histology (F).

