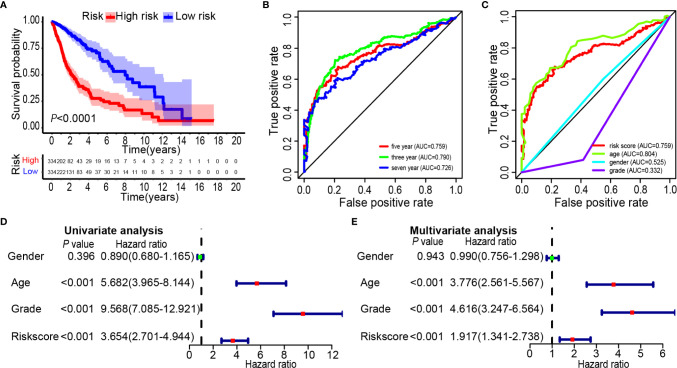
Figure 6.
Prognostic significance of the 25-gene signature derived risk scores in TCGA cohort. (A) Kaplan-Meier analysis of TCGA gliomas patients was stratified by median risk. High-risk scores are associated with general poor survival of gliomas. (B, C) Multi-index ROC curve of risk score and other indicators. (D) Univariate Cox regression analysis. Forest plot of associations between risk factors and the survival of gliomas. (E) Multiple Cox regression analysis. The ferroptosis-related gene signature is an independent predictor of gliomas.

