Figure 7.
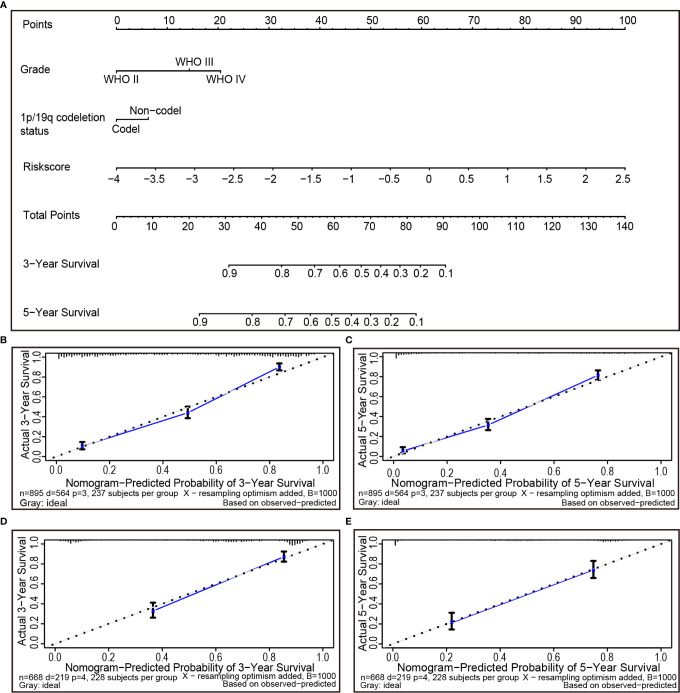
The nomogram can predict the prognosis probability in gliomas. (A) A nomogram of the gliomas cohort (training set) used to predict the overall survival. (B, C) Calibration maps used to predict the 3-year (B) and 5-year survival (C) in the training set. Calibration plots for 3-year (D) and 5-year survival (E) in the TCGA cohort (test group). The x-axis and y-axis represent the predicted and actual survival rates of the nomogram, respectively. The solid line represents the predicted nomogram, and the vertical line represents the 95% confidence interval.

