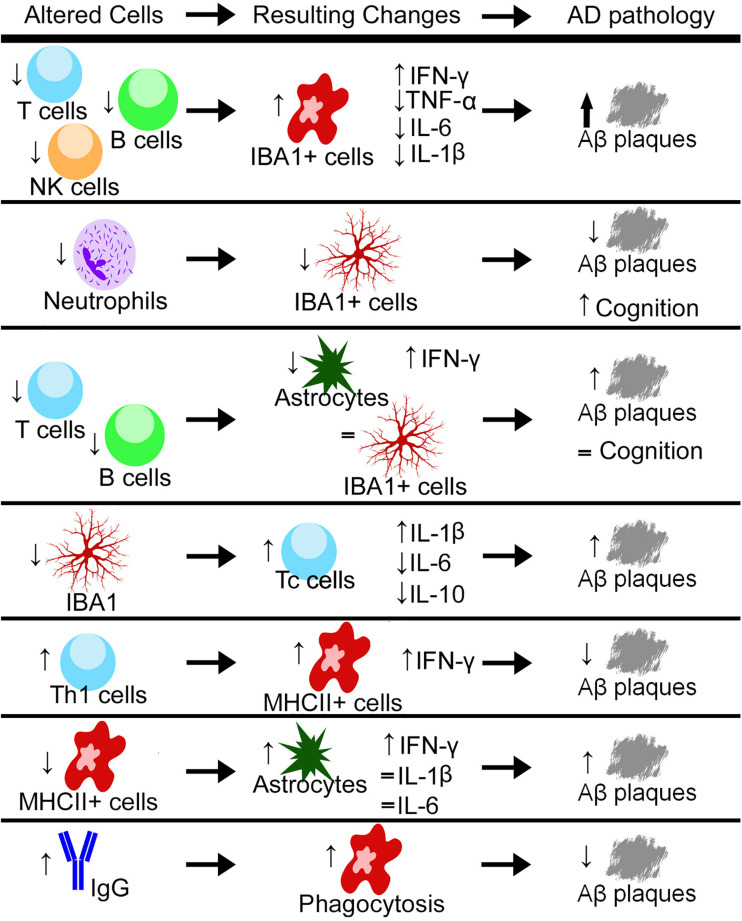
FIGURE 1.
Through either genetic or pharmacological mechanisms, different cell types and a variety of cytokines are increased or decreased and the resulting changes in the pathology of Alzheimer’s disease (AD) have been measured. Up arrows indicate increases, down arrows indicate decreases, and equal signs indicate no measured change. Aβ, Amyloid-Beta; Th1, T helper cells type 1; Tc, Cytotoxic T cell; NK, natural killer; IBA1, ionized calcium-binding adaptor molecule 1; IFN-γ, interferon gamma; TNF-α, tumor necrosis factor alpha; IL, interleukin; MHCII, major histocompatibility complex class II.

