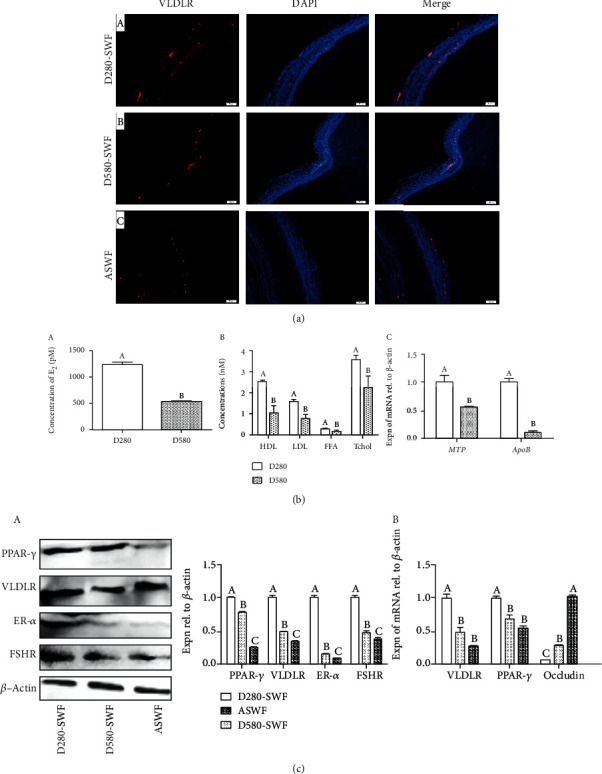
Figure 2.

Changes of yolk deposition capacity in SWFs (D280 and D580 hens) and ASWFs (D580 hens). (a) Immunofluorescent staining of VLDLR in SWFs (D280, D580) and ASWFs at physiological state. Red: VLDLR-labelled cells. Blue: DAPI staining. Scale bar: 50 μm. (b) A and B: the levels of serum E2 and plasma HDL, LDL, FFA, and Tchol. C: Expression of MTP and ApoB mRNAs in PHFs of D280 and D580 hens. (c) Analysis of the PPAR-γ, VLDLR, ER-α, FSHR, and occludin expression in SWFs (D280 and D580 hens) and ASWFs (D580 hens). Values represent the means ± SEM in each group (n = 15). Different lowercase letters indicate significant difference (P < 0.05).
