
Figure 2.
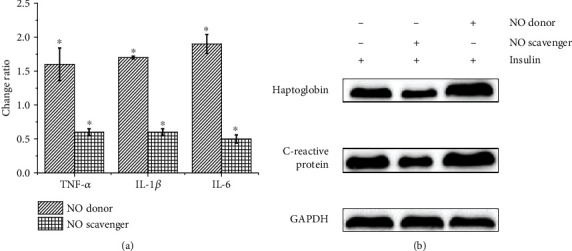
The inflammatory factor levels in HepG2 cells. (a) The ratio of TNF-α, IL-1β, and IL-6 contents in insulin-induced HepG2 cells treated with NO donor or NO scavenger and TNF-α, IL-1β, and IL-6 contents in untreated insulin-induced HepG2 cells. (b) Western blot detects the C-reactive protein and heptoglobin expression in insulin-induced HepG2 cells after different treatments.