Figure 6.

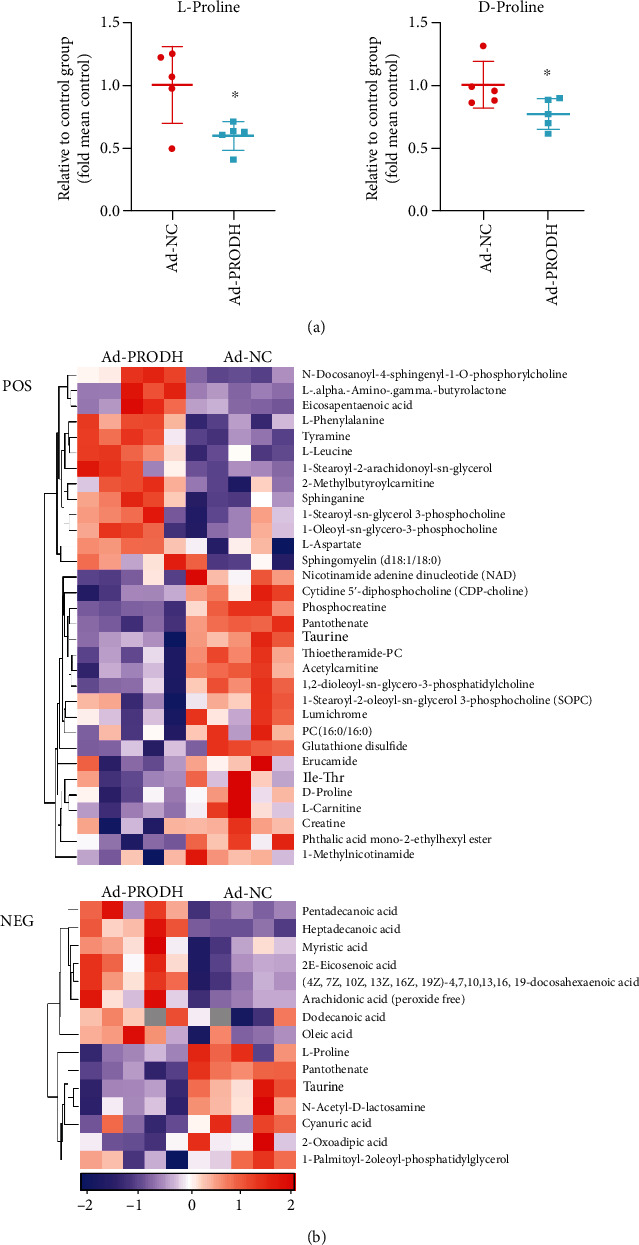
(a) Relative levels of L-proline and D-proline in the Ad-NC group and the Ad-PRODH group. (b) Heat map of the 47 differentially regulated endogenous metabolites between the Ad-NC group and the Ad-PRODH group in positive and negative ion modes. The data are presented as the mean ± SD values. ∗p < 0.05 versus the normoxia control group.
