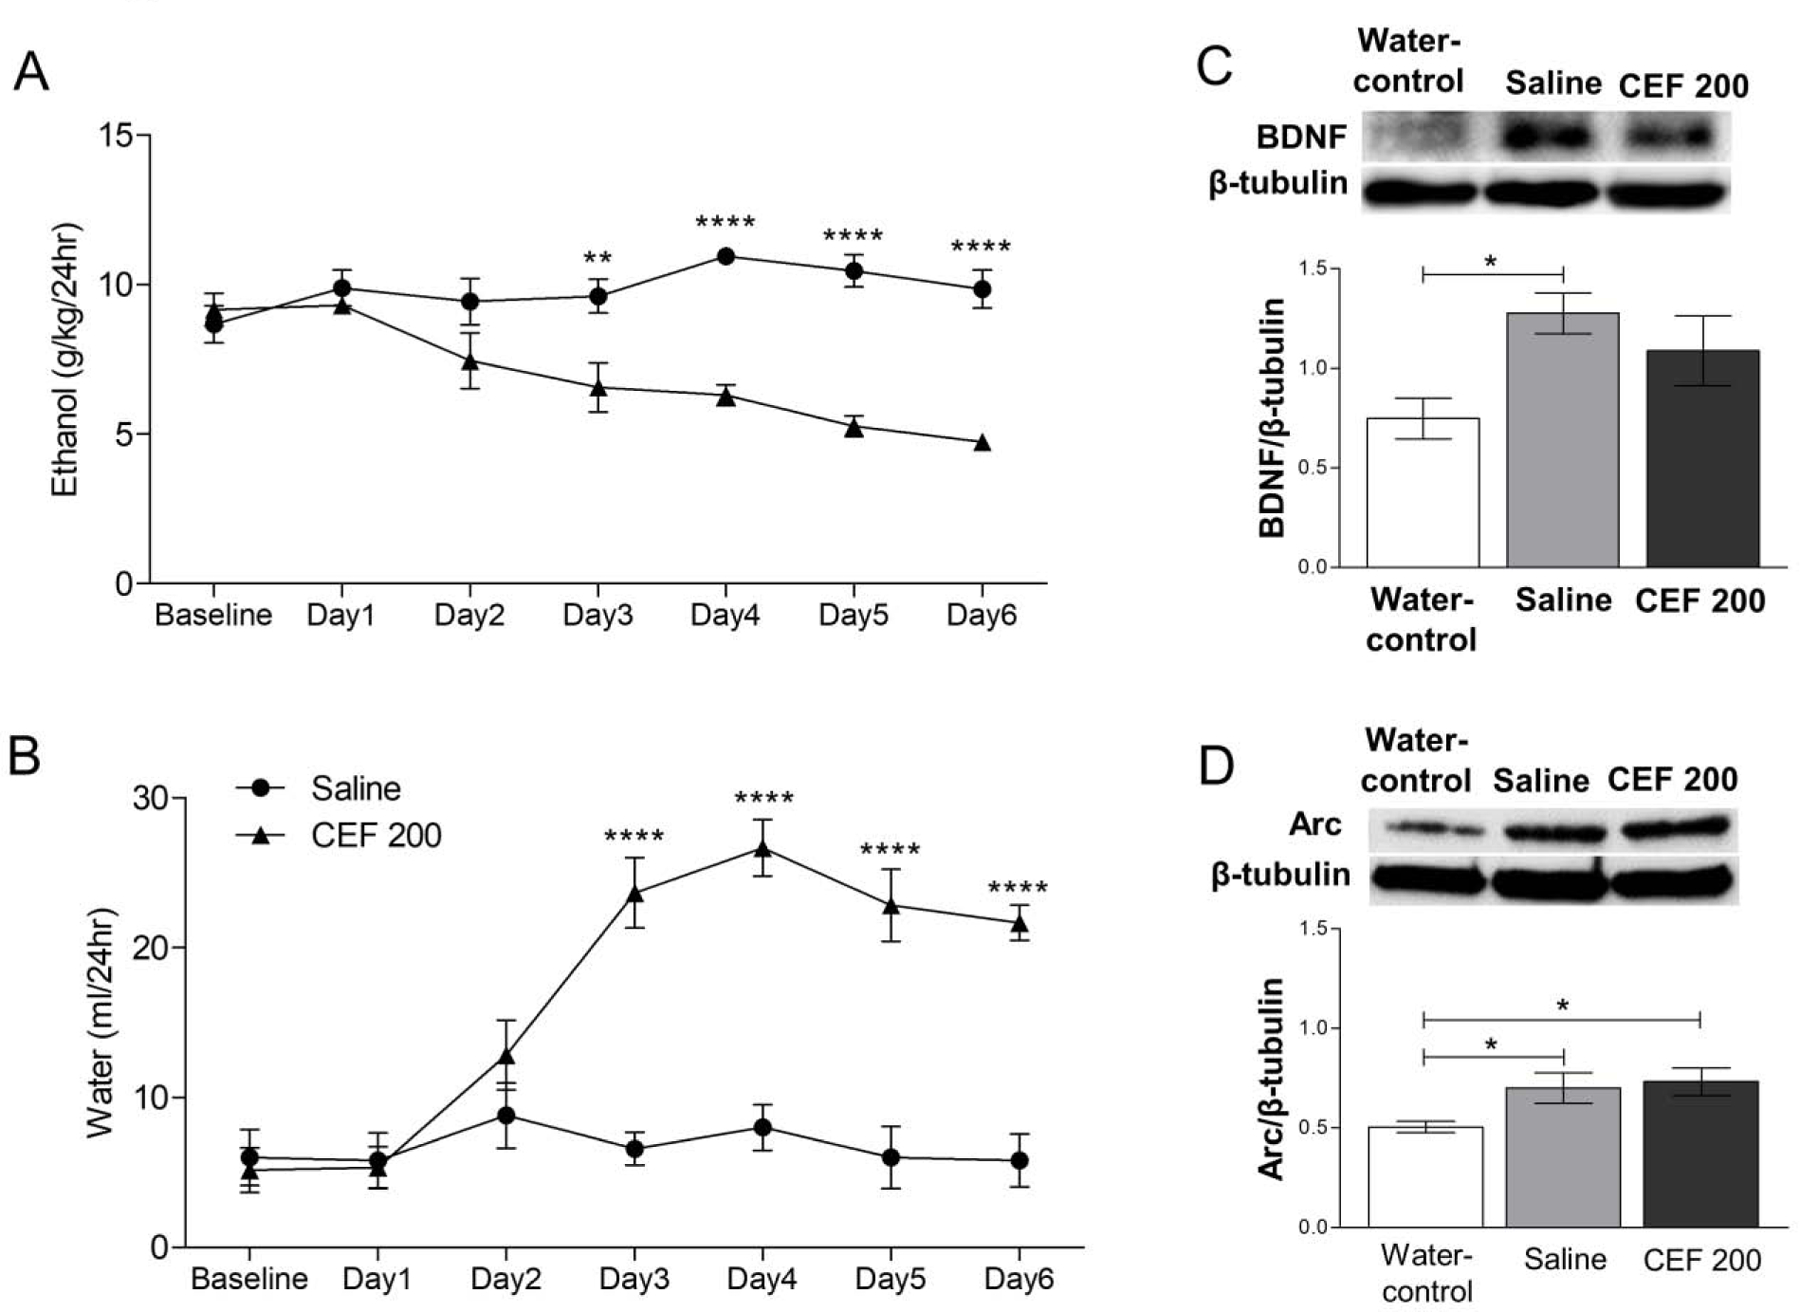
Figure 7. Effects of ceftriaxone treatment on ethanol and water drinking behavior and expression of BDNF and Arc in the AcbSh.

(A) CEF (200 mg/kg, i.p.) treatment significantly reduced ethanol consumption in Day 3 through Day 6 as compared to saline treated group (n=5–6/group). (B) Water consumption was significantly increased in CEF group compared to saline treated group in Day 3 through Day 6 (n=5–6/group). (C) Representative immunoblots for BDNF and β-tubulin of water-control, ethanol-saline (saline) and ethanol-CEF 200 (CEF 200) groups in the AcbSh (upper panel). Statistical analyses revealed that BDNF expression was significantly increased in ethanol-saline group compared to water-control group. There was no significant change in BDNF expression in CEF 200 group compared to ethanol-saline and water-control groups (lower panel). (D) Representative immunoblots for Arc and β-tubulin of water-control, saline and CEF 200 groups in the AcbSh (upper panel). Statistical analyses revealed that Arc expression was significantly increased in ethanol-saline and ethanol-CEF 200 group compared to water-control group. There was no significant change in the expression between CEF 200 and saline groups (lower panel). Data are shown as mean ± SEM; (*p < 0.05, **p < 0.01 and ****p<0.0001); (n = 6 for each group).
