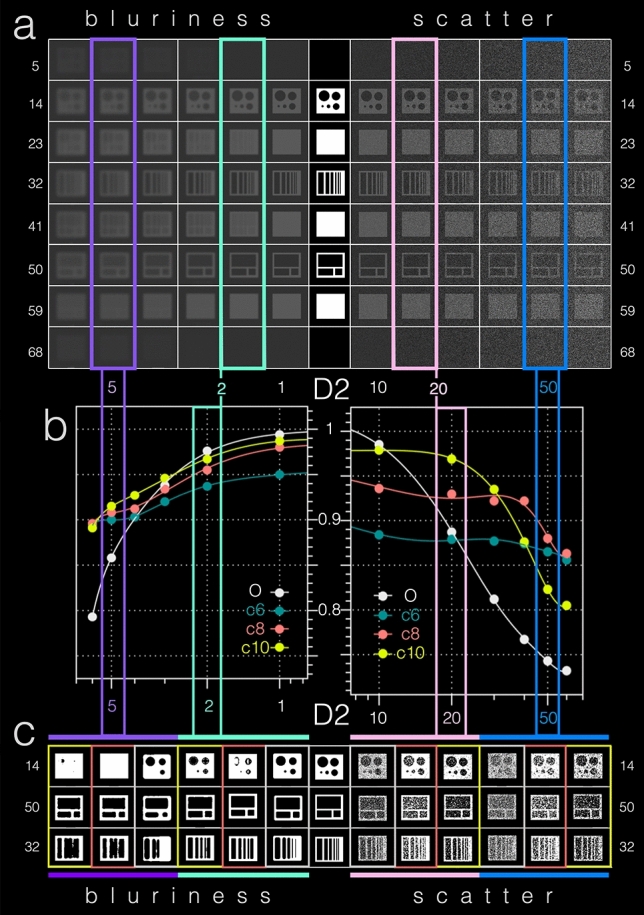
Fig. 1.

D2 artificial data set–visualization and results. As an artificial data set, D2 provided a known ground truth to test and compare VOLT cutoff versions to Otsu’s method. a A transversal slice-wise visualization of D2 in the middle. D2 can be viewed in the very middle and included an 8-bit cuboid volume with different sizes of cylindrical and cuboid-shaped cutouts (signal). To this signal different types of real-world MRI imitating noise were added stepwise in the form of increasing blurriness (Gaussian blur kernel, SD range 1–6 voxel in x/y/z-direction; SD = standard deviations, visualized to the left) and increasing scatter (SD range of intensity variation: 0–50 SD, visualized to the right). b Based on empirical observations in the development data set (D1), VOLT was compared to Otsu’s method (O = grey) at three cutoff variations (c6 = forest green, c8 = red, c10 = yellow). Both VOLT cutoff versions and Otsu’s method fared better with blurriness noise (x-axis of the left graph) in comparison with scatter noise (x-axis of the right graph). More specifically, VOLT cutoff versions showed a high level of agreement in terms of Dice overlap (y-axis within the graphs) with Otsu’s scores in data sets with low noise levels (please compare blurriness 2, framed in mint green and scatter 20, framed in pink). The higher the noise level, the more VOLT cutoff versions outperformed Otsu’s method (please note blurriness 5, framed in purple and scatter 50, framed in blue). The corresponding output (c) can easily be compared with the ground-truth by following said color frames. D2 data set 2, c6 cutoff 6, c8 cutoff 8, c10 cutoff 10, O Otsu’s method
