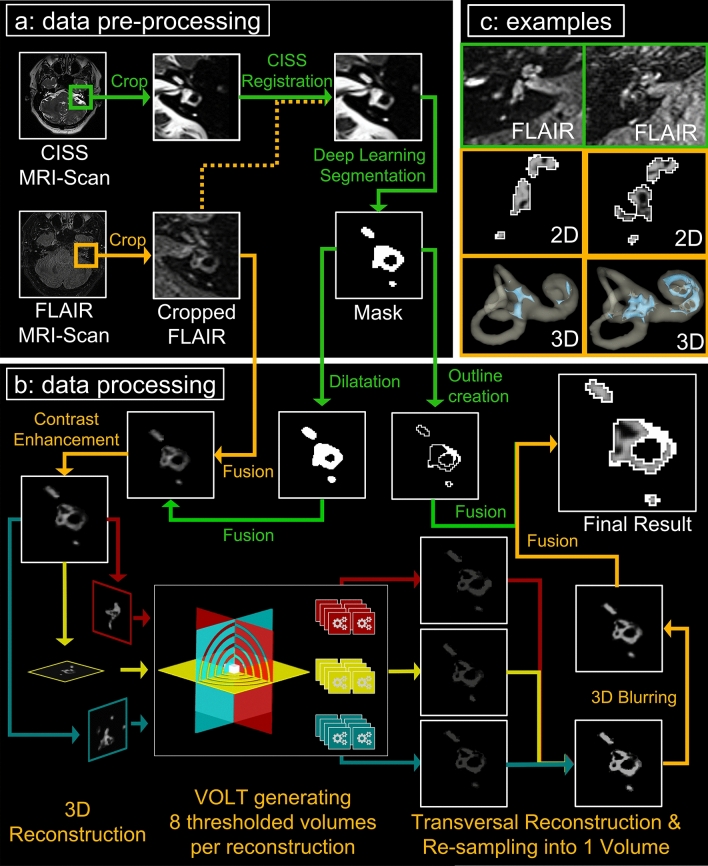
Fig. 2.
VOLT flowchart and output examples. The flowchart shows a step-by-step overview of the VOLT processing pipeline of a left inner ear. The different steps correspond to the boxes in a counterclockwise fashion (a, b, c). a Describes data pre-processing, b data processing, and c shows output examples. Within each box, processing steps following orange arrows indicate the order of the main program steps, and green arrows indicate supporting steps. Data pre-processing (a) consists of cropping the inner ear from CISS and FLAIR MR images (only step requiring user input), co-registration, and using a cloud-based deep convolutional neural network (CNN) to create a mask of the inner ear. During data processing, (b) the mask is dilated to include a small seam around the inner ear region-of-interest (ROI). Then, a fusion volume is created, contrast-enhanced, and the fusion volume is 3D reconstructed. VOLT is performed, volumes are reconstructed into a transversal plane and re-sampled into one volume. After 3D blurring, single-voxel noise is removed, and a three-dimensional outline based on the mask is added to the final result. (c) depicts two output examples of the right inner ear. The upper row shows the corresponding cropped FLAIR-MR image; the middle row shows a 2D depiction of the VOLT output, and the lower row shows the 3D visualization of VOLT-output. The inner ear to the left displays no endolymphatic hydrops (ELH). The inner ear to the right displays an ELH grade 2. CISS constructive interference in steady-state, MR magnetic resonance, FLAIR fluid-attenuated inversion recovery, VOLT volumetric local thresholding

