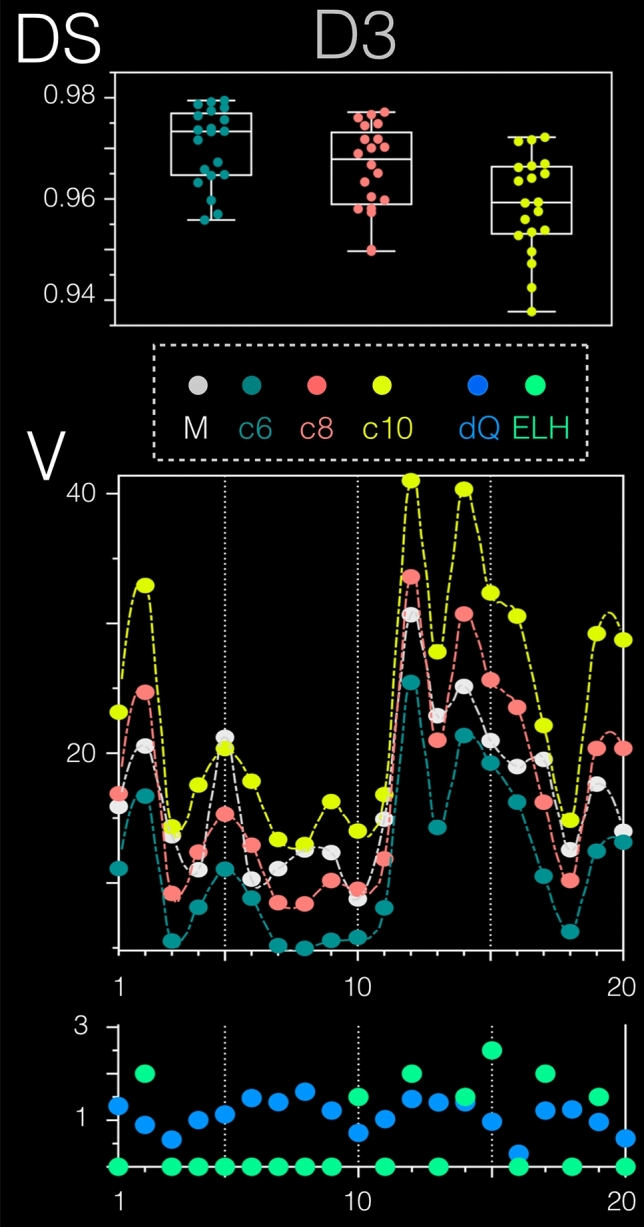
Fig. 3.

D3 prospective validation data set results. D3 was used to validate VOLT on entirely unseen real-world data (20 inner ears). VOLT with the three variations cutoff 6 (c6 = dark green), cutoff 8 (c8 = red), and cutoff 10 (c10 = yellow) were compared to manual (M) segmentation (= grey, that was considered the gold standard). Ear-specific segmentation accuracy was evaluated using the Sørensen-Dice overlap coefficient (DS, upper graph), and segmentation precision were estimated by comparing the volume of the ELS (V, middle graph). Overall, DS of all three VOLT variations was high (c6: 97.0% 0.7, c8: 96.6% 0.8, c10: 95.9% 97% 0.9). The influence of endolymphatic hydrops (ELH = colored light green) and data quality (dQ = colored blue) can easily be seen in the lowest graph. Data quality was defined as mean the greyscale value (or intensity). Note that the grade of ELH correlated significantly with the endolymphatic volume of both the manual segmentation method (p < 0.05) and VOLT cutoff variations c6-8–10 (p < 0.01). c6 cutoff 6, c8 cutoff 8, c10 cutoff 10, D3 data set 3, dQ data quality, DS Dice score, M manual segmentation
