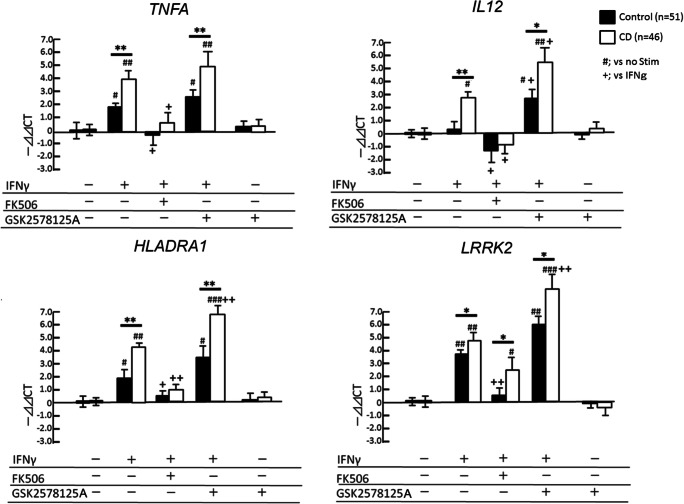
Fig. 2.
Gene expression analyses of IFN-γ stimulated CD14+ monocytes in CD cases. CD14+ monocytes from healthy control (Control, n = 51) and CD cases (n = 46) are subjected to ex vivo stimulation with 100 IU/mL IFN-γ in the presence or absence of FK506 and GSK2578215A (LRRK2-specific kinase inhibitor) for 4 h. The gene expression of TNFA, IL12, HLADRA1 and LRRK2 are examined. * or ** denotes p < 0.05 and 0.01 vs. controls with the same ex vivo treatment. #, ## or ### denotes p < 0.05, 0.01 or 0.001 vs. unstimulated group of the same subjects. + or ++ denotes p < 0.05 or 0.01 vs. IFN-γ-stimulated group of the same subjects as determined by one-way ANOVA with Tukey post hoc.

