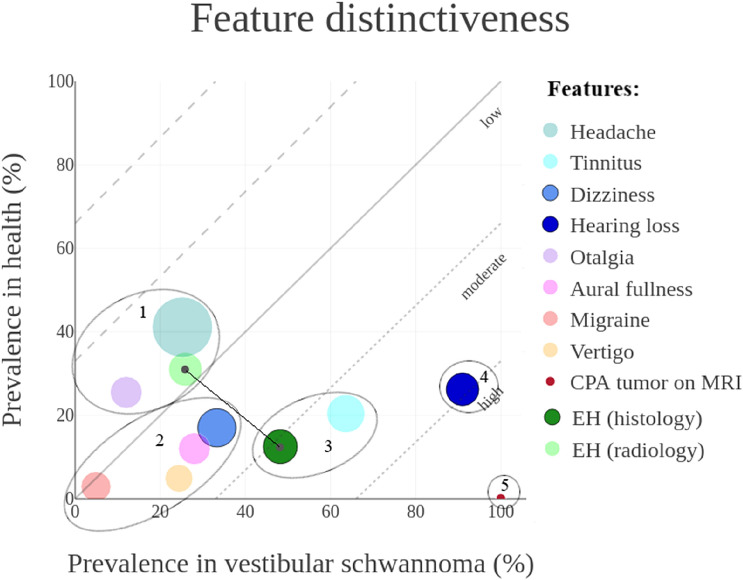
Fig. 2.
Graphical representation of feature distinctiveness in a four-dimensional (x,y,r,α) bubble chart. Estimated prevalences in patients diagnosed with vestibular schwannoma and healthy references were plotted on the x-axis and y-axis, respectively. This resulted in a low, moderate, or high level of distinctiveness. The overall feature prevalence in both health and disease were presented as bubble size (r). The reliability of the results was presented by transparency (α). Features plotted under the reference line were distinctive for vestibular schwannoma. The absolute distance between EH (histology) and EH (radiology) represented the discrepancy in distinctiveness between the two techniques

