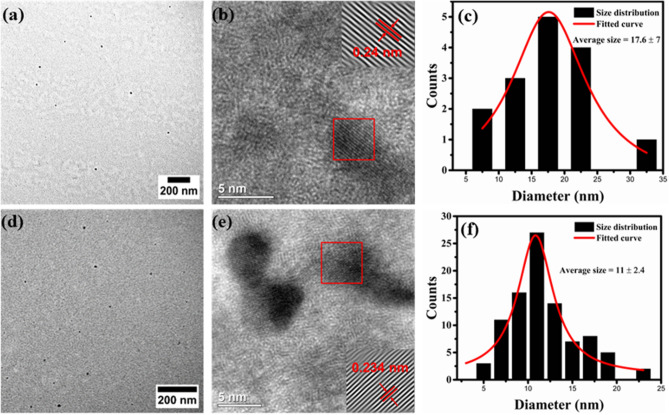
Figure 4.
(a) TEM image, (b) HRTEM image and (c) respective particle size distribution of GQDs-500. (d) TEM, (e) HRTEM and (f) size distribution measurements of GQDs-900. Both types of GQDs were obtained after 120 min of treatment. Images in (a), (b), (d) and (e) were processed using DigitalMicrograph 3.40.2804.0 (https://www.gatan.com) and plotted using ImageJ 1.8.0_112 (https://imagej.nih.gov/ij/). Figures (c) and (e) were plotted using OriginPro 2018b (https://www.originlab.com).

