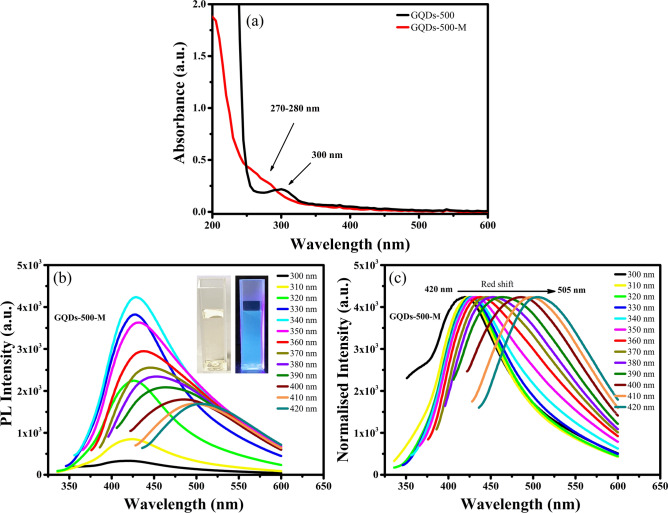
Figure 5.
(a) UV–Vis spectra of GQDs-500 and GQDs-500-M showing a strong absorption at 300 and 270–280 nm range, respectively. (b) The PL spectra of GQDs-500-M at a range of excitation wavelengths (insets are the photographs of GQDs-500-M solution under visible and 365 nm UV light) and (c) normalised PL spectra showing a red shift in PL emission. Figures (a)–(c) were plotted using OriginPro 2018b (https://www.originlab.com) and inset photographs in (b) were taken using iPhone Xs Max (https://www.apple.com).

