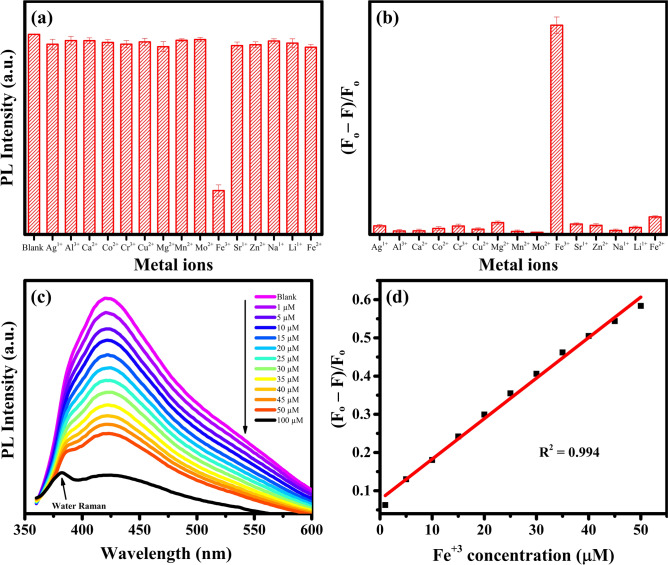
Figure 8.
(a) Comparison of the PL intensities of 50 μg mL−1 GQDs-500-M solution in the presence of different metal ions (100 µM) at an excitation wavelength of 340 nm. (b) The comparison of the affinity of different metal ions towards GQDs-500-M (F0 and F are the PL intensities of GQDs-500-M without and with 100 µM of different metal ions). (c) The PL spectra of GQDs-500-M at different concentrations of Fe3+ and (d) corresponding linear plot. Three independent experiments were carried out to obtain the mean values. Figures were drawn using OriginPro 2018b (https://www.originlab.com).

