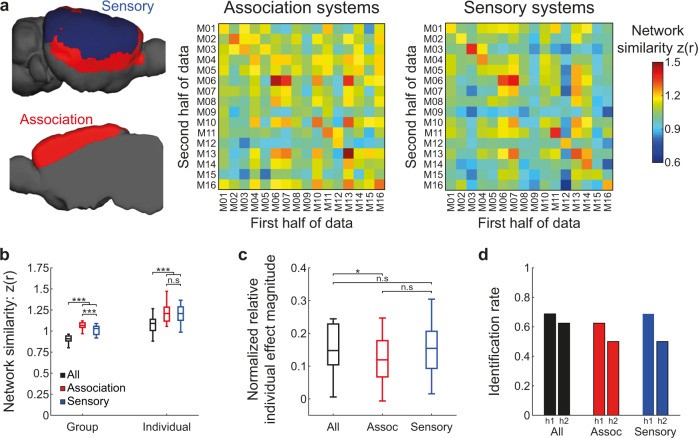
Fig. 3. Comparison of individual variation between association and sensory cortical systems.
a Segmentation of cortical modules to association and sensory networks (left) and the similarity matrices between individual connectomes which were limited to either association or sensory regions (right). b Comparison between group and individual similarities of the full connectome (All) and the connectomes built using only association (Assoc) or sensory regions demonstrates that the full connectome is characterized by lower similarity values at both Group and Individual levels (n = 16 mice, ***P < 0.001). Boxplots represent the median (center line), interquartile range (box limits) and 1.5 × interquartile range (whiskers). c Comparison between normalized relative individual effect magnitude of the different connectomes reveals no difference between sensory and association networks. However, comparison between sensory and association networks to the full connectome revealed lower normalized relative individual effect magnitude only in association networks (n = 16 mice, *P < 0.05). d Identification rates of individual mice using the three different connectomes, demonstrate slightly increased performance in the full connectome with minimal differences between association and sensory networks. h1, first half of data; h2, second half.

