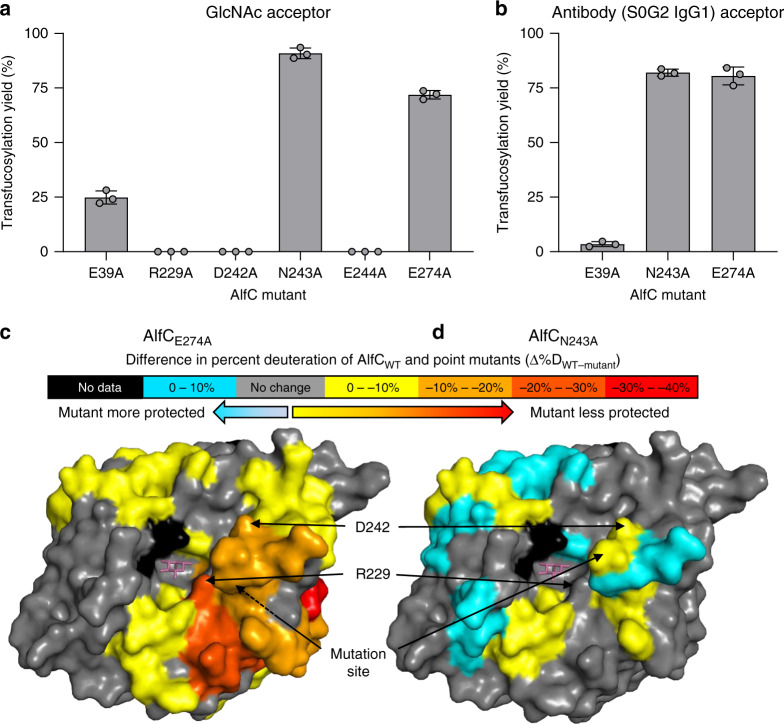
Fig. 6. Analysis of AlfC transfucosylation mutants.
a AlfC catalyzed transfer of fucose from α-fucosyl fluoride; and b IgG1 antibody (S0G2 glycoform). Separate reactions were measured with error bars representing standard deviation of n = 3 independent experiments. Data are presented as mean values ± SEM. c, d Hydrogen–deuterium exchange mass spectrometry analysis of transfucosylation mutants. Maximum differences in percent deuteration of peptides at 10 s or 1 min from c AlfCE274A and d AlfCN243A compared to wild-type. Differences are mapped onto a surface representation of AlfC bound to fucose (magenta). The site of mutation and the position of D242 are annotated with arrows. Source data are provided as a Source Data file.

