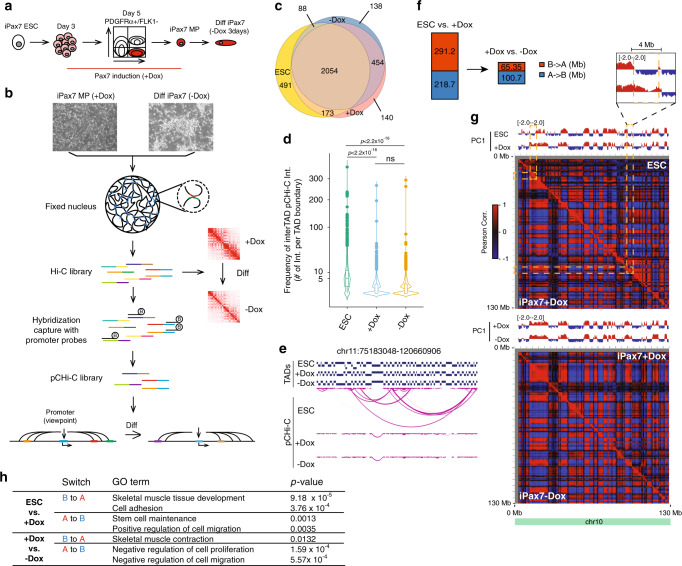
Fig. 1. Global chromatin conformational changes during muscle cell progenitor specification and differentiation.
a Scheme for the generation of iPax7 skeletal muscle progenitors (MP) and differentiated derivatives (Diff). b Scheme showing experimental design to generate genome-wide Hi-C and pCHi-C maps in undifferentiated (+Dox) and differentiated (−Dox) iPax7 cells. c Venn diagram showing overlap of TADs identified in ESC, iPax7+Dox, and iPax7−Dox populations. d Violin plot showing the frequency of significant inter-TAD interactions identified by pCHi-C at each TAD boundary in ESCs (n = 2816) and iPax7 (+Dox (n = 2821) and –Dox (n = 2734)) cells. The boxplot within each violin plot shows the 25th and 75th percentile (bottom and top of box), and median value (horizontal band inside box). The whiskers indicate the values observed within up to 1.5 times the interquartile range above and below the box. Statistical significance tested with two-tailed Student’s t-test. e Representative example of a genomic region with high-confidence inter-TAD pCHi-C interactions primarily observed in ESCs but not iPax7 cells. Each magenta arc depicts a high-confidence pCHi-C interaction. f Quantification of genome-wide compartment switches from B to A (red) and A to B (blue) for ESCs vs. +Dox iPax7 and +Dox vs. −Dox iPax7 populations. Switches are quantified in Mb. g Compartment changes at chr10 for ESCs vs. iPax7+Dox (top) and iPax7+Dox vs. iPax7−Dox (bottom). PC1 value tracks (red: positive values; blue: negative values) and Pearson correlation matrices for the intra-chromosomal interaction profiles were generated at 500 kb resolution for comparison. Selected regions showing compartmental switching are highlighted with yellow dashed rectangles. h GO analysis of select groups of genes located in compartments altered when comparing ESCs vs. +Dox iPax7 cells and +Dox vs. −Dox iPax7 populations.

