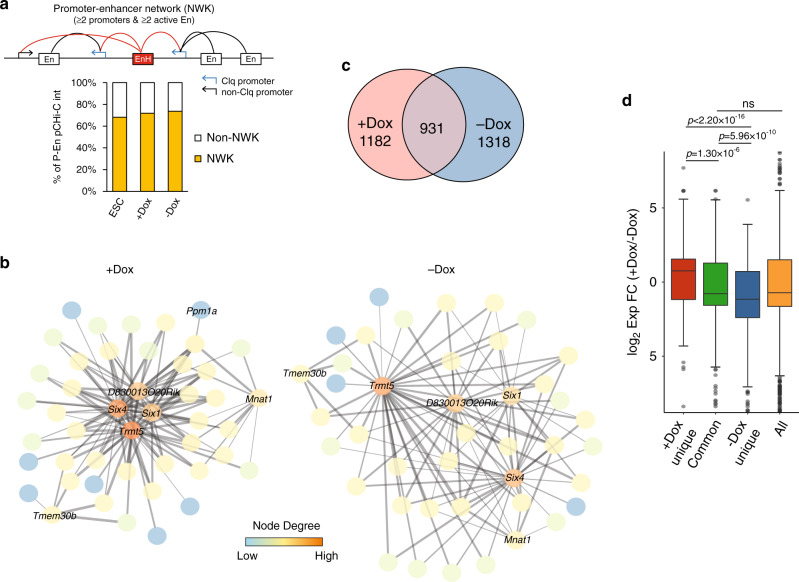
Fig. 6. A structural and functional role for enhancer hubs (EnHs) in forming P–En networks during myogenic differentiation.
a Identification of P–En networks (NWK) in ESCs (n = 261), +Dox (n = 790), and –Dox (n = 880) iPax7 cells. (Top) Schematic of a P–En network connected through an EnH (in red). (Bottom) Quantification of P–En interactions involved in P–En networks in each population. b P–En networks of the Six1/4 locus in +Dox and −Dox iPax7 cells graphed with Cytoscape. No network was detectable at these loci in ESCs. Each node represents a pCHi-C captured region, and promoters were labeled with their corresponding gene names, while enhancers were left unlabeled. Each gray line between nodes represents a high-confidence pCHi-C interaction, and the thickness of the line indicates the strength of the interaction measured by the CHiCAGO score. Node degree from low to high reflects the relative frequency of connections from one node to other nodes within the motif. c Overlap between EnHs in +Dox and −Dox iPax7 cells. d Corresponding transcriptional changes during iPax7 cell differentiation for target genes in each EnH group from c. Only differentially expressed genes (padj < 0.05 from paired DESeq2) are included (n = 446, 430, and 547 for group ‘+Dox unique’, ‘Common’, and ‘−Dox unique’, respectively). All differentially expressed genes in iPax7 cells (n = 2831) are used as a control. The boxes denote the 25th and 75th percentile (bottom and top of box), and median value (horizontal band inside box). The whiskers indicate the values observed within up to 1.5 times the interquartile range above and below the box. Statistical significance tested with two-tailed Student’s t-test.

