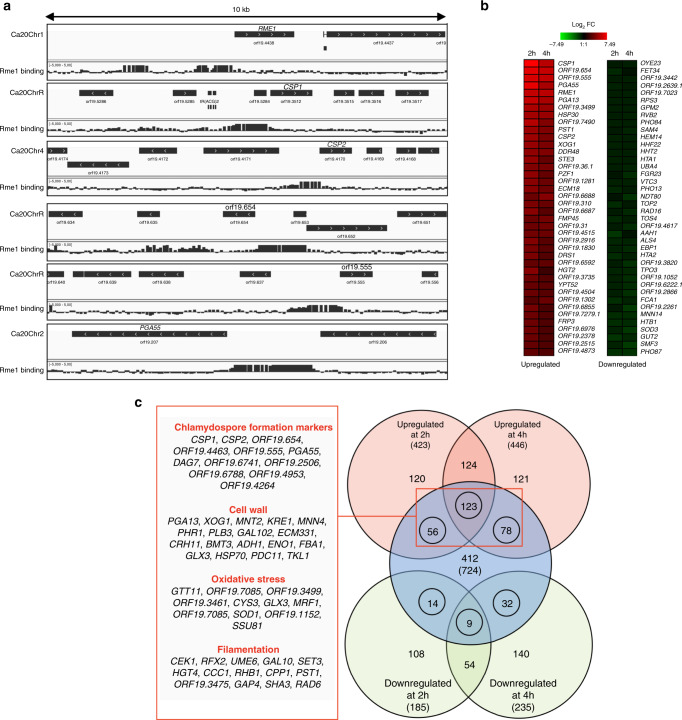
Fig. 1. C. albicans Rme1 is a positive regulator of chlamydospore formation markers.
a Rme1 occupancies along 10-kb intervals of selected locations from the C. albicans genome (Assembly 20, the corresponding chromosome numbers are indicated on the left of each panel). The relative signal intensities of the 60-bp probes covering the whole C. albicans genome following enrichment of the rTAP-tagged Rme1-coimmunoprecipitated DNA relative to DNA from a mock immunoprecipitation (in an untagged strain background) are plotted. Data from one ChIP-chip experiment out of two are shown. The orientation of each ORF is depicted by the arrows in the black rectangles. Binding maps were generated using the IGV genome browser61. b Heat map showing the expression pattern in PTET-RME1 transcript profiling data at time points 2 and 4 h after induction with 40 μg/mL doxycycline. The heat map was generated with Genesis version 1.7.674 using the average expression level of three replicates. Genes were ranked according to average expression value between the two time points. c Venn diagram showing the overlap between genes transcriptionally modulated by PTET-RME1 at time points 2 and 4 h (gene expression fold-change ≥1.5 or ≤−1.5; P < 0.05, two-tailed Welch’s t-test, n = 3 independent biological samples) and bound by Rme1. Numbers in Venn diagram indicate the number of genes and those between parentheses indicate the total number of upregulated (light red circles), downregulated (light green circles) and bound (light blue circle) genes. Numbers within the circles indicate the number of genes that are both bound and transcriptionally modulated by Rme1. The name of few genes and their functional categories are shown in the linked red box (55 out of 257 bound and upregulated genes are shown). The ChIP-chip experiments was performed with two independent biological replicates, over two experiments.

