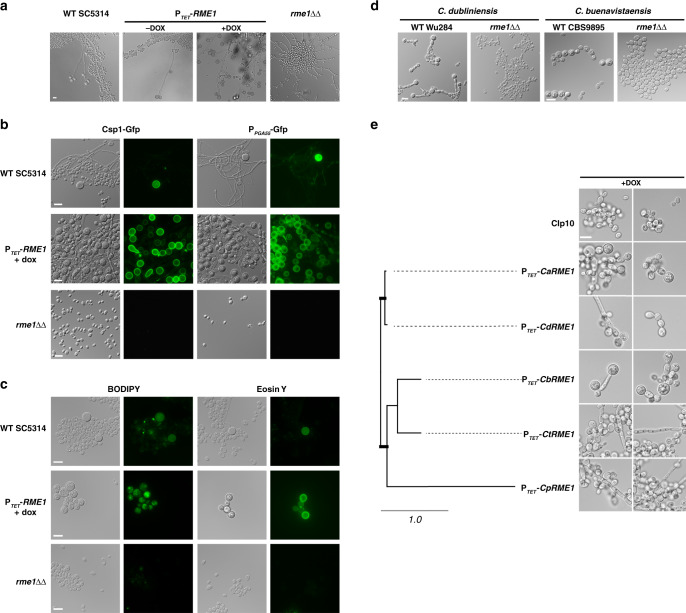
Fig. 2. RME1 controls chlamydospore formation.
a C. albicans WT SC5314, PTET-RME1 (CEC5031) and rme1ΔΔ (CEC4694) strains growing on PCB agar plates. Photomicrographs were taken after 3 days of incubation at 25 °C in the dark and under microaerophilic conditions. Scale bar = 10 μm, applies to all pictures. b Both Csp1 and Pga55 expressions are dependent on Rme1. C. albicans WT SC5314, PTET-RME1 and rme1ΔΔ strains expressing either the CSP1-GFP or PPGA55-GFP fusions (CEC4783, CEC4827, CEC4788, CEC4791, CEC4967 and CEC4804, respectively) were cultured on a cellophane film covering PCB plates at 25 °C, in the dark and under microaerophilic conditions for 3 days. Cells were recovered from the cellophane film and inspected by phase contrast and fluorescence microscopy. Induction of Rme1 was achieved by adding doxycycline to the medium to a final concentration of 40 μg/mL. Scale bars = 10 μm. c C. albicans WT SC5314, PTET-RME1 (CEC4741) and rme1ΔΔ (CEC4694) strains grown for 2–6 days in PCB medium supplemented with doxycycline for inducing RME1 overexpression were incubated with BODIPY or Eosin Y. Scale bars = 10 μm. d C. dubliniensis WT Wü284 and its rme1ΔΔ derivative (left panels) and C. buenavistaensis CBS9895 and its rme1ΔΔ derivative (right panels) were grown in PCB liquid medium at 25 °C, in the dark, during 24 h. Scale bars = 10 μm. e C. albicans rme1ΔΔ strains with conditional heterologous RME1 overexpression were grown overnight in liquid doxycycline-containing PCB, in the dark, at 25 °C. CaRME1: C. albicans, CdRME1: C. dubliniensis, CbRME1: C. buenavistaensis (all chlamydospore proficient species), CtRME1: C. tropicalis and CpRME1: C. parapsilosis (chlamydospore deficient species). Two representative fields are presented for each strain, all images are at the same scale. Scale bar = 10 μm. The tree has been generated with PHYML72 from a multiple alignment of Rme1 protein sequences done with MUSCLE69 (Supplementary Fig. 3). Thick bars represent bootstrap supports >98% (bootstrap analysis of 100 resampled datasets); branch lengths are shown and the scale bar represents 1 substitution per site.

