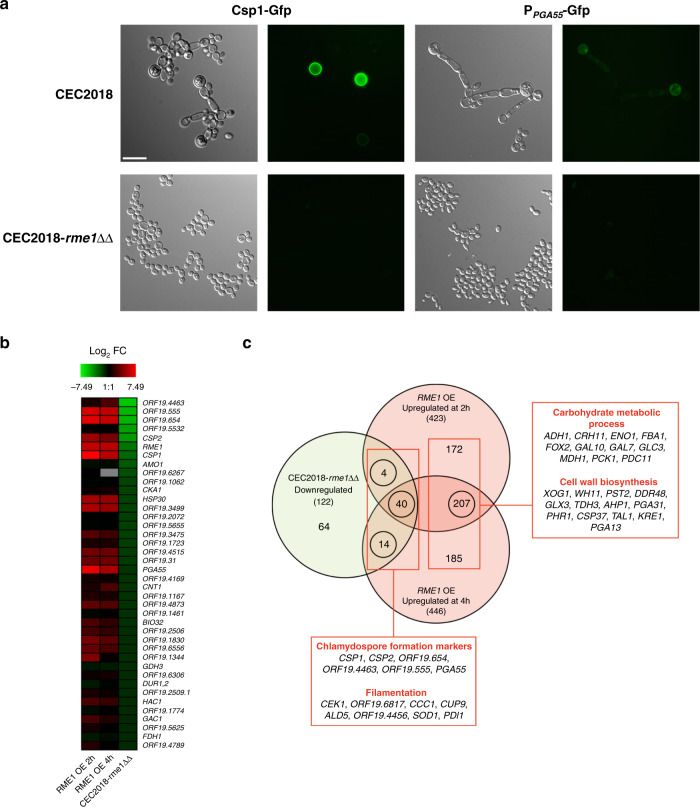
Fig. 4. RME1 disruption in the clinical isolate CEC2018 confirms Rme1 involvement in chlamydosporulation.
a Strain CEC2018 and the CEC2018-rme1ΔΔ derivative expressing the CSP1-GFP (left panels) and PPGA55-GFP (right panels) fusions were cultured in PCB liquid medium at 25 °C for 24 h and then inspected by phase contrast and fluorescence microscopy. Scale bar = 10 μm. b Heat map comparing the downregulated genes in the transcriptomic analysis performed in the CEC2018-rme1ΔΔ strain (gene expression fold-change ≤ −1.5; P < 0.05, n = 3 independent biological replicates) and the upregulated genes at 2 h and 4 h in the expression profiling in the strain expressing PTET-RME1 (gene expression fold-change ≥1.5; P < 0.05; statistical significance was assessed using a two-tailed Welch’s t-test, n = 3 independent biological samples). c Venn diagram showing the overlap between the upregulated genes by PTET-RME1 at 2 h and 4 h (gene expression fold-change ≥1.5; P < 0.05, n = 3 independent biological replicates) and the downregulated genes (gene expression fold-change ≤ −1.5; P < 0.05, n = 3 independent biological replicates) in the CEC2018-rme1ΔΔ strain. Numbers in Venn diagram represent the number of modulated genes and those between parentheses indicate the total number of upregulated genes upon RME1 overexpression (light red circles) and downregulated ones in the rme1ΔΔ mutant (light green circle). Circled numbers represent the overlap of transcriptionally modulated genes in both experiments. The linked red box shows the name of a few genes and their corresponding functional categories. Statistical significance was assessed using a two-tailed Welch’s t-test.

