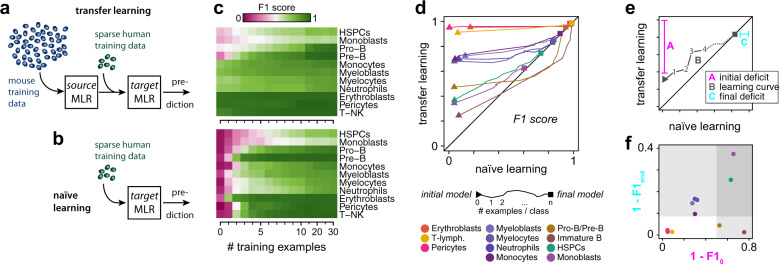
Fig. 3. Mapping biology from mouse to human using transfer learning.
a Schematic of the transfer learning process. Abundant data from source domain (here the mouse) are used to train a source MLR. Sparse data from the target domain (here the humans) is used to fine-tune the parameters of the source MLR, thereby transferring knowledge from source to target domain. b Schematic of naïve learning as a control for transfer learning. Rather than updating the pre-trained mouse model, a series of separate MLRs are trained from random initial conditions on sparse data from the human target domain. c Both transfer and naïve learning improves with the number of human samples used for training (shown is data for 0,1, 2, …, 10, 15, 20, 25, 30 human cells per class). Transfer learning performance (top) and naïve learning (bottom). Displayed is the average F1 score from fivefold cross-validation as a measure of classifier performance. d Learning curves illustrate the evolution of classification performance starting from the initial mouse (triangle) to the final model (square; trained on 30 human examples per class). e Schematic to interpret the learning curves in panel d. Three features are of importance. A is the initial performance deficit = 1 – F10, where F10 is the F1 score of the mouse model in predicting human samples. B is the learning curve: each point on this curve plots the F1 score of the re-trained mouse model against the naïve human model for a fixed number of human training examples from 0 to 30 per class. C is the final performance deficit = 1 – F1end, where F1end is the F1 score of the naïve human model trained on 30 samples per class in predicting human samples. The line y = x is in black. On this line the naïve and re-trained models have equivalent accuracy for the same number of human training samples. At this point the advantage of transfer learning is neutralized, and equivalent learning can be achieved by a naïve human model. All learning trajectories eventually converge to this line. f Cell types may be grouped by their initial and final performance deficits. Equivalent re-training results for the ANN classifier are shown in Supplementary Fig. 5.

