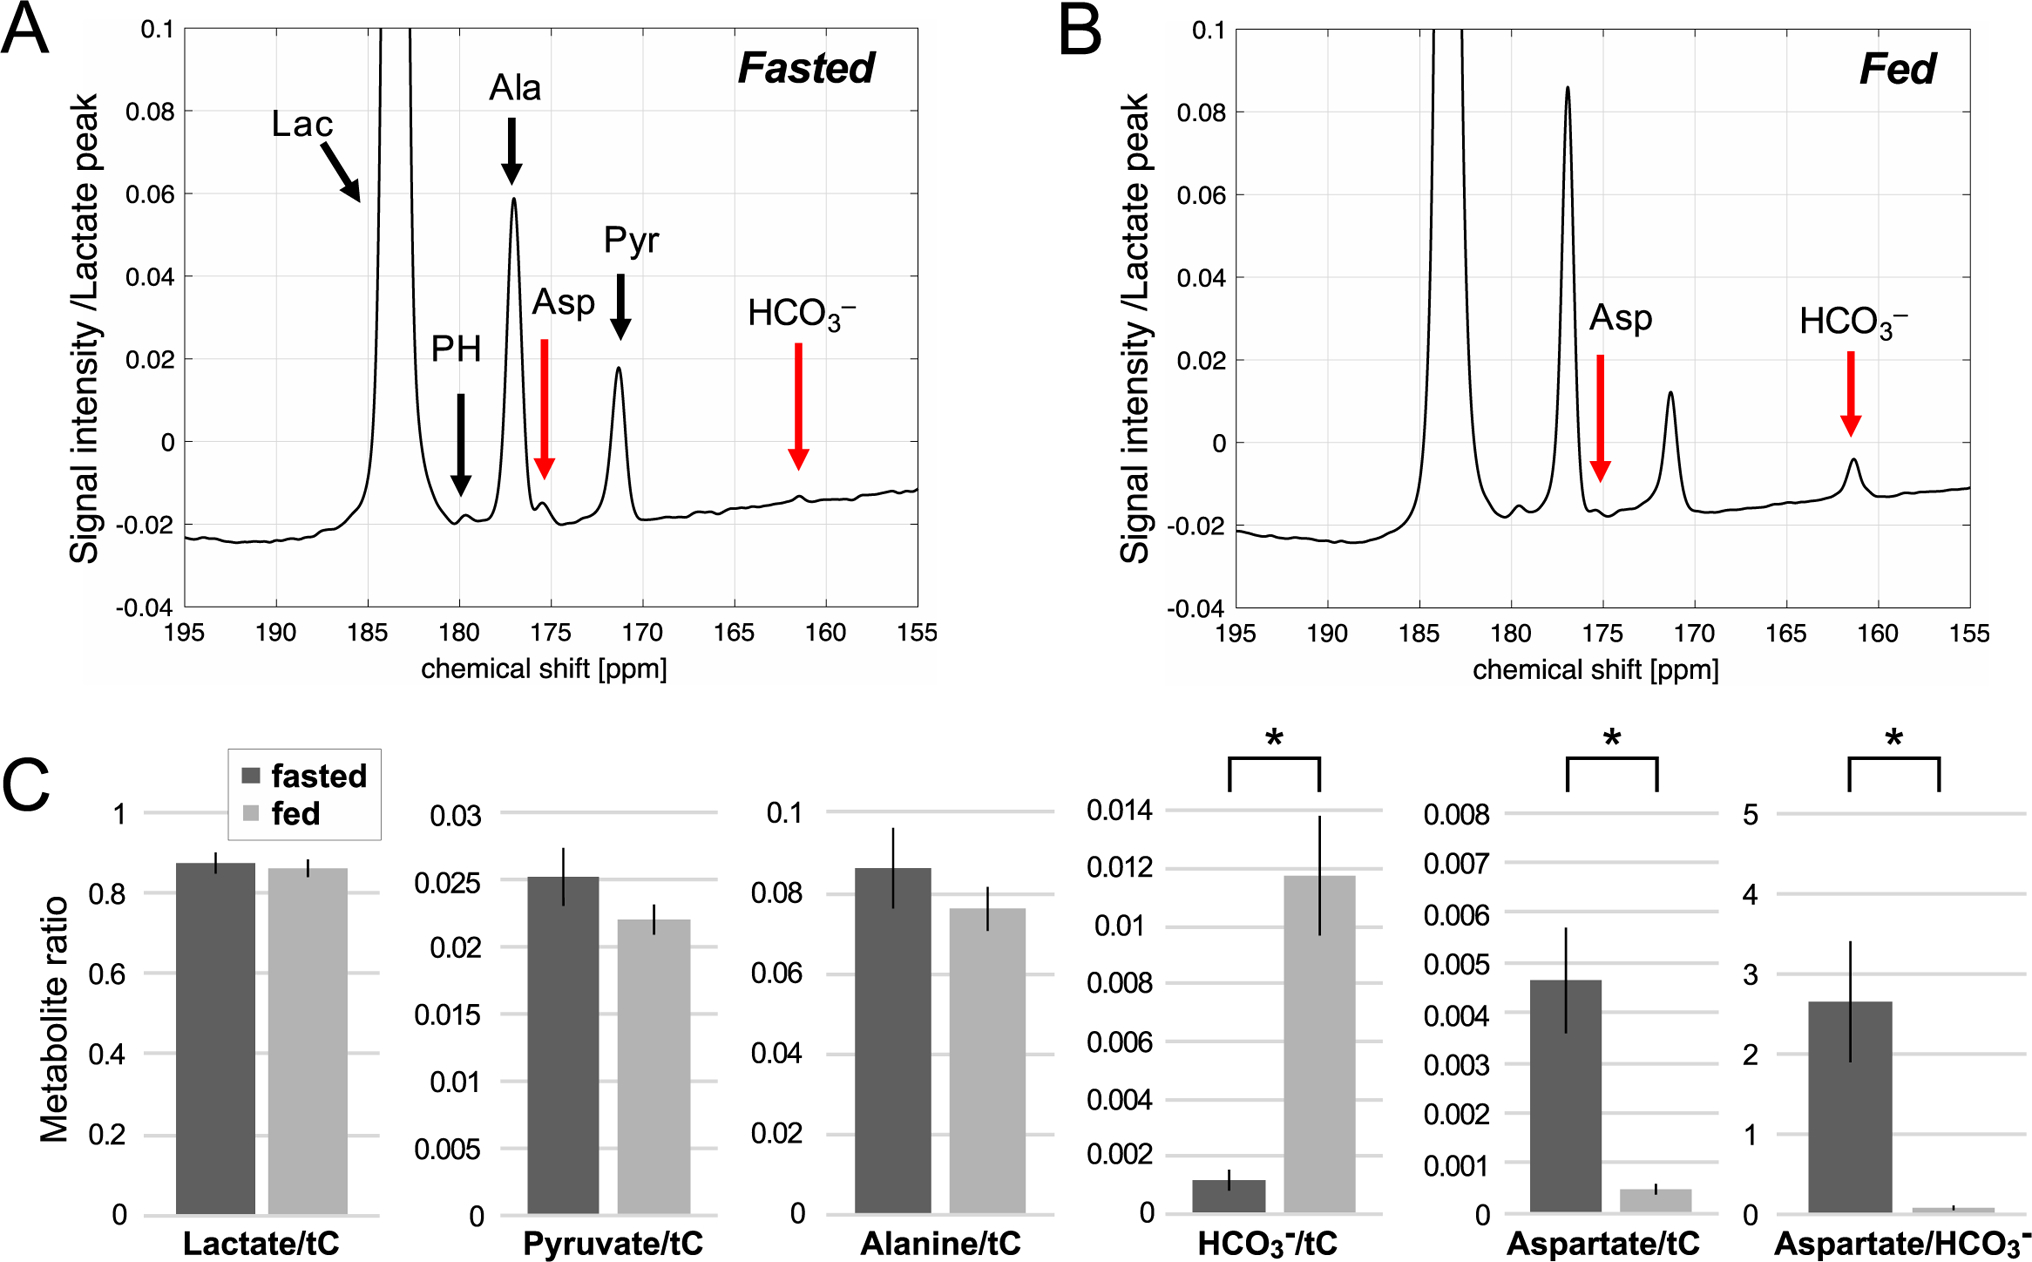
Figure 3.

Time-averaged spectra of 60-mM hyperpolarized [1-13C]-L-lactate in the liver of (A) fasted and (B) fed rats. The spectrum is normalized to the maximum [1-13C]lactate peak intensity. (C) Comparison of lactate signals and products, normalized by the total hyperpolarized carbon (tC) signals in the fasted and fed groups. * indicates statistical significance between the groups (P < 0.01). Lac: lactate, PH: pyruvate hydrate, Ala: alanine, Asp: aspartate, Pyr: pyruvate, HCO3–: bicarbonate.
