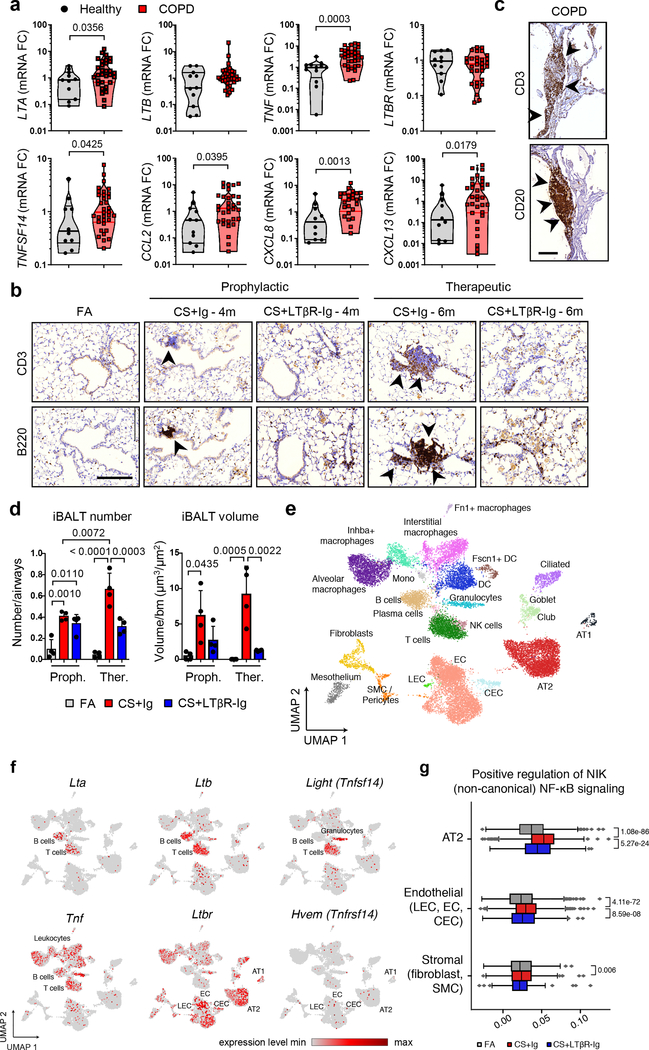
Fig. 1. LTβR-signalling is activated in COPD and inhibition disrupts iBALT in the lungs of CS-exposed mice.
a, mRNA expression levels of genes indicated determined by qPCR in lung core biopsies from healthy (n=11) and COPD patients (n=32). b, Representative images of immunohistochemical analysis for B220+ B cells and CD3+ T cells (brown signal, arrows, haematoxylin counter stained, scale bar 200μm) in lung sections from B6 mice exposed to FA or CS for 4m and 6m, plus LTβR-Ig or control Ig prophylactically from 2m - 4m (CS + LTβR-Ig – 4m) and therapeutically from 4m - 6m (CS + LTβR-Ig – 6m), see Extended Data Fig. 1i. (n=4 mice/group, repeated twice). c, Representative lung sections from COPD patients stained for CD20+ B cells and CD3+ T cells (brown signal, arrows, haematoxylin counter stained, scale bar 200μm, n=4). d, Quantification of lung iBALT from mice described in (b), as mean iBALT number/airway and volume of iBALT normalised to surface area of airway basement membrane (bm), data shown mean ± SD (n=4 mice/group, repeated twice, Proph., prophylactic; Ther., therapeutic). e-g, Cells from whole lung suspensions of B6 mice exposed to FA (n=3) or CS for 6m, plus LTβR-Ig (n=5) or control Ig (n=5) therapeutically, were analysed at 6m by scRNA-Seq (Drop-Seq). e, UMAP of scRNA-Seq profiles (dots) coloured by cell type. f, UMAP plots showing expression of genes indicated in scRNA-Seq profiles. g, Box and whiskers plot (box 25th-75th percentile, median line indicated and whiskers representing +/− 1.5 IQR) showing relative score for positive regulation of NIK (non-canonical) NFκB signalling pathway (GO:1901224) in cells indicated. Statistical significance indicated and was assessed using Wilcoxon rank-sum test on normalized, log transformed count values and corrected with Benjamini-Hochberg (g). P values indicated, Mann-Whitney one-sided test (a) and one-way ANOVA multiple comparisons Bonferroni test (g).

