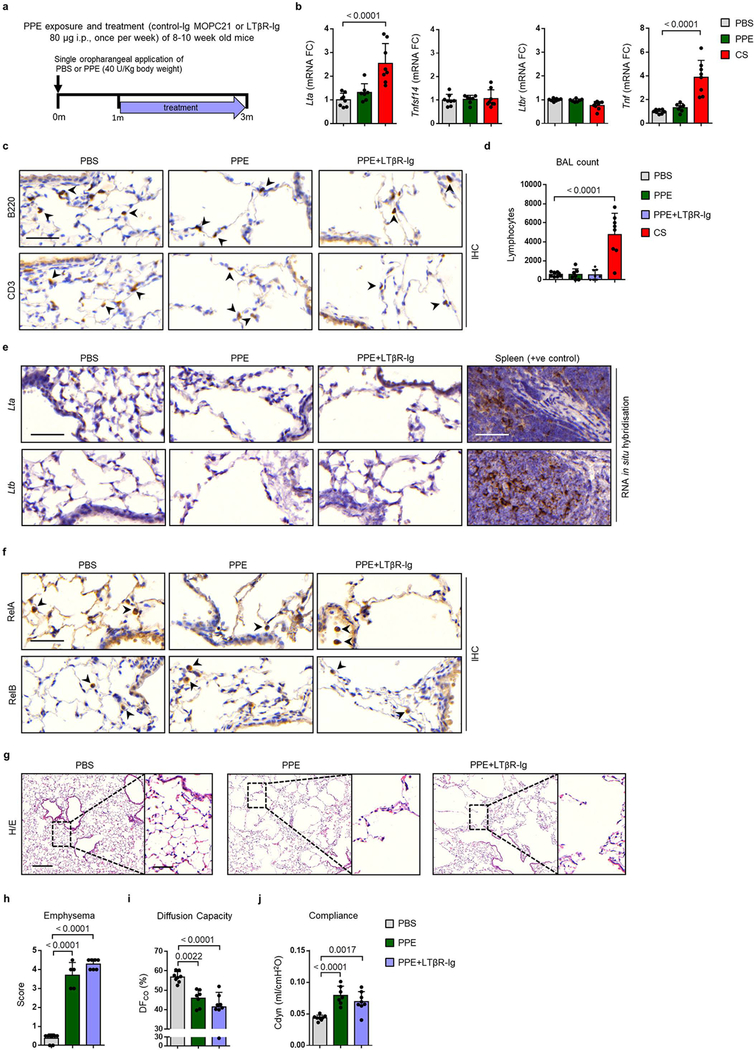
Extended Data Fig. 7. Disease development is not attenuated by LTβR-Ig treatment in iBALT independent emphysema.
a, Schematic representation of the LTβR-Ig treatment protocol in mice exposed to a single oropharangeal application of porcine pancreatic elastase (PPE) or PBS control. b, mRNA expression level fold changes (FC) of Lta, Tnfsf14 (Light), Ltbr and Tnf relative to Hprt, determined by qPCR in whole lung from B6 mice treated with a single oropharyngeal application of PBS (n=8), porcine pancreatic elastase (PPE, 40 U/kg body weight) analysed after 3m (n=7) or 4m chronic cigarette smoke exposure (CS) (n=8 mice/group). c, Representative images of immunohistochemical analysis for B220 positive B cells and CD3 positive T cells (brown signal, indicated by arrow heads, haematoxylin counter stained, scale bar 50μm) in lung sections from PBS and PPE treated mice described in (b) plus mice treated with PPE followed by LTβR-Ig fusion protein (80 μg i.p., weekly) 28d later for 2m (n=8 mice/group, repeated twice). d, Lymphocyte counts in the bronchoalveolar lavage (BAL) from the mice described in (c) plus mice exposed to CS for 4m (n=8 mice/group). e, Representative images of in situ hybridisation analysis for Lta and Ltb in lung sections from mice described in (c), plus splenic positive controls, (brown staining, haematoxylin counter stained, scale bar 50μm) (n=4 mice/group, repeated twice). f, Representative images of immunohistochemical analysis for RelA and RelB in lung sections from B6 mice described in (c) (brown signal indicated by arrow heads, haematoxylin counter stained, scale bar 50μm) (n=4 mice/group, repeated twice). g, Representative images of H/E stained lung sections (scale bar 200μm and 50μm inset) from the lungs of mice described in (c) (n=8 mice/group, repeated twice). h, Emphysema scoring (1–5, 5 most severe) of lung sections from (f) (n=5 mice PBS, 5 mice PPE, 7 mice PPE+LTβR-Ig groups). i, Diffusing capacity of carbon monoxide (DFCO) in the lungs of mice described in (c) (n=8 mice PBS, 7 mice PPE, 8 mice PPE+LTβR-Ig groups). j, Dynamic compliance (Cdyn) pulmonary function data from the mice described in (c) (n=8 mice PBS, 7 mice PPE, 8 mice PPE+LTβR-Ig groups). Data shown mean ± SD. P values indicated, one-way ANOVA multiple comparisons Bonferroni test.

