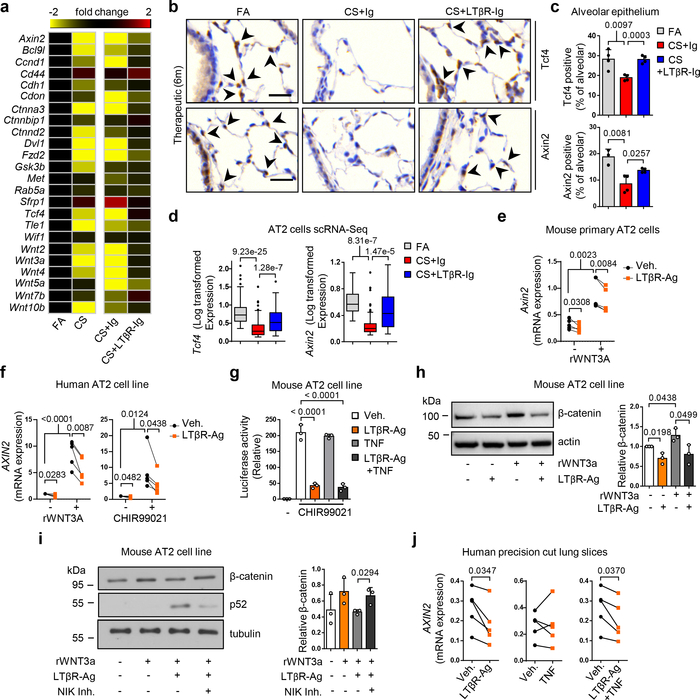
Fig. 3. Blocking LTβR-signalling induces Wnt/β-catenin in alveolar epithelial cells.
a, Heat map of mRNA abundance of Wnt signalling pathway genes determined by RT-qPCR from lungs of mice indicated at 6m. b, Representative images of immunohistochemical analysis for Tcf4 and Axin2 in lung sections from B6 mice treated as indicated (n=4 mice/group, brown signal, arrows, haematoxylin counter stained, scale bar 25μm). c, Quantification of alveolar epithelial cells positive for Tcf4 and Axin2 from (b). d, Normalised, Log transformed expression levels of Tcf4 and Axin2 in AT2 cells following scRNA-seq analysis. e, mRNA expression levels of Axin2 relative to Hprt, in primary murine AT2 cells with LTβR agonistic antibody (LTβR-Ag, 2 μg/ml) for 24h +/− rWNT3A (100ng/ml) (n=5 independent experiments). f, mRNA expression levels of AXIN2 relative to HPRT (normalized to Vehicle, Veh.) in A549 (human AT2) cell line with hLTβR-Ag (0.5 μg/ml) for 24h +/− rWNT3A (100ng/ml) and GSK-3β inhibitor (CHIR99021, 1μM) (n=5 independent experiments). g, Wnt/β-catenin luciferase reporter activity in MLE12 (murine AT2) cell line, activated with CHIR99021 (1μM) +/− LTβR-Ag (2 μg/ml) or rTNF (1 ng/ml) for 24h (n=3, representative of 5 independent experiments). h, Western blot analysis for β-catenin in MLE12 cells with LTβR-Ag (2 μg/ml) for 24h +/− rWNT3A (100ng/ml). Quantification relative to actin (n=3 independent experiments). For gel source data see Supplementary Fig 1. i, Western blot analysis for β-catenin and p52 in MLE12 cells with rWNT3A (200ng/ml) and LTβR-Ag (2 μg/ml) for 30h following 2h pre-treatment with NIK kinase specific inhibitor (Cmp1, 1μM). Quantification relative to tubulin (n=3 independent experiments). For gel source data see Supplementary Fig 1. j, mRNA expression level of AXIN2 relative to HPRT, in ex vivo human precision-cut lung slices stimulated for 24h with rTNF (20ng/ml) or hLTβR-Ag (2 μg/ml) (n=6 slices from individual lungs). Data shown mean ± SD (c, g-i), box and whiskers plots (box 25th-75th percentile, median line indicated and whiskers representing +/− 1.5 IQR) (d), individual lungs (e,j), or individual experiments (f). P values indicated, one-way ANOVA multiple comparisons Bonferroni test (g), Wilcoxon rank-sum test (two-sided) corrected with Benjamini-Hochberg (d), paired Student’s two-tailed t test (e,f,j), or Student’s two-tailed t test (c, h-i).

