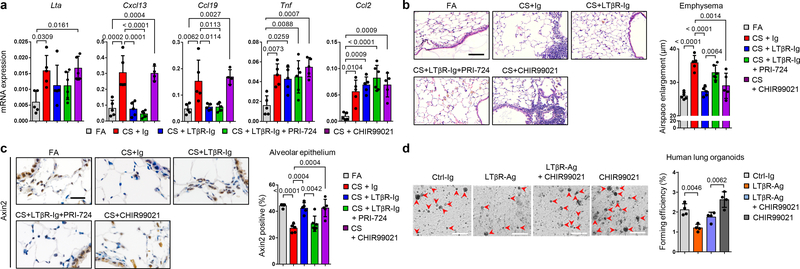
Fig. 4. Blocking WNT/β-catenin signalling reverses LTβR-Ig induced regeneration.
a-c, B6 mice were exposed to FA (n=5) or CS for 6m plus control Ig (n=5), LTβR-Ig (80 μg i.p., weekly, n=5), LTβR-Ig + beta-catenin/CBP inhibitor PRI-724 (0.6mg i.p., 2x weekly, n=6) or CHIR99021 (0.75mg i.p., weekly, n=5) from 4m – 6m, and analysed at 6m, see Extended Data Fig. 10a. a, Lung mRNA expression levels of genes indicated relative to Hprt determined by qPCR. b, Representative images of H/E stained lung sections (scale bar 100μm) and quantification of airspace enlargement as mean chord length. c, Representative images of immunohistochemical analysis for Axin2 in lung sections (brown signal, haematoxylin counter stained, scale bar 50μm) and quantification of alveolar epithelial cells positive for Axin2. d, Representative images and quantification of lung organoids from primary human AT2 cells cultured for 14d +/− human LTβR-Ag (2 μg/ml) and CHIR99021 (2μM), see Extended Data Fig. 10e (scale bar 500μm, n=2 replicates from 2 separate donors). Data shown mean ± SD, P values indicated, one-way ANOVA multiple comparisons Bonferroni test (a-d).

