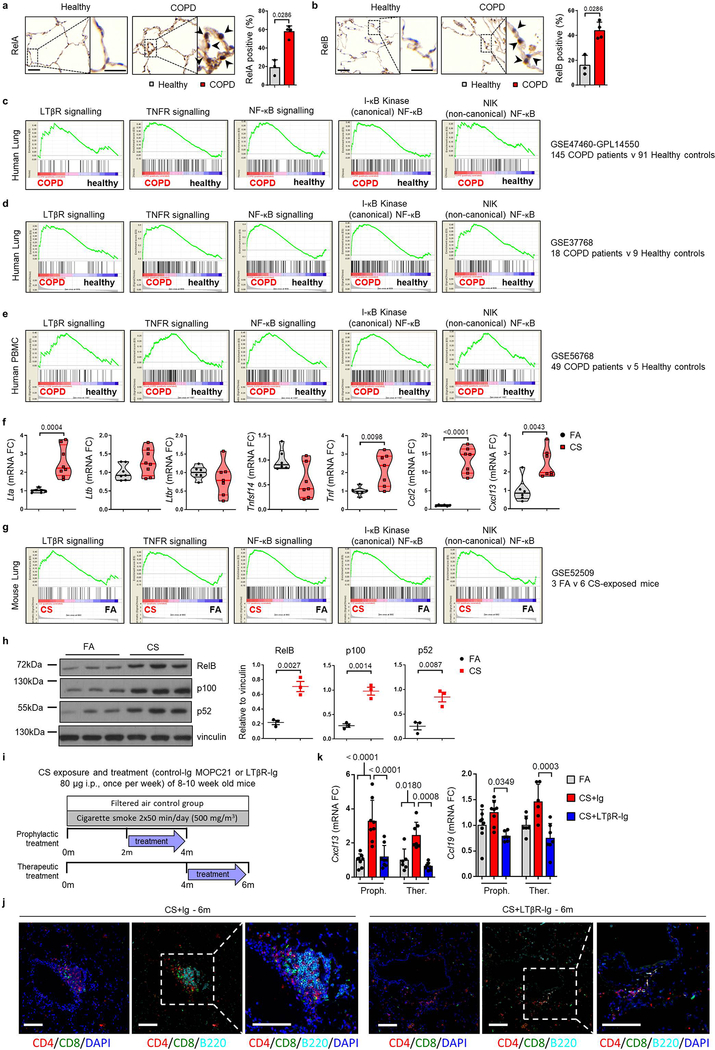
Extended Data Fig. 1. Canonical and non-canonical NFκB-signalling pathways are activated in the lungs of COPD patients and CS-exposed mice.
a-b, Representative images of immunohistochemical analysis for RelA (a) and RelB (b) (brown signal, indicated by arrows, haematoxylin counter stained, scale bar 50μm, zoomed area 25μm) in lung core biopsy sections from healthy (n=3) and COPD patients (n=4), with the quantification of RelA and RelB positive alveolar epithelial nuclei shown as mean ± SD. c-e, Gene set enrichment analysis (GSEA) of the LTβR signalling, NF-κB signalling (gene lists from IPA software, Qiagen), TNFR-mediated signalling (GO:0033209), positive regulation of I-kappaB kinase NF-kappaB signalling (GO:0043123) and NIK NF-kappaB signalling (GO:0038061) pathways in publically available array data from lung tissue (GSE47460-GPL14550) of healthy (n=91) v COPD patients (n=145) (c), from lung tissue (GSE37768) of healthy (n=9) v COPD patients (n=18) (d) and from peripheral blood mononuclear cells (GSE56768) of healthy (n=5) v COPD patients (n=49) (e). f, mRNA expression levels of Lta, Ltbr, Tnfsf14 (Light), Tnf, Ccl2 and Cxcl13 determined by qPCR in whole lung from B6 mice exposed to filtered air (FA, n=6) or cigarette smoke (CS, n=8) for 6m, individual mice shown. g, GSEA of the pathways described in (c-e) in the publically available array data (GSE52509) of lungs from our mice exposed to filtere air (FA, n=3) and cigarette smoke (CS, n=6) for 4 and 6m. h, Western blot analysis for RelB, p100 and p52 in total lung homogenate from the mice described in (f). Quantification relative to vinculin of individual mice shown (n=3). For gel source data see Supplementary Fig 1. i, Schematic representation of the LTβR-Ig treatment protocol. j, Representative low and high magnification overlay images of Multiplex immunofluorescence staining to identify CD4 (Red), CD8 (Green), B220 (Turquoise) and DAPI (blue) counterstained lung sections (Scale bars 100μm, n=4) from B6 mice exposed to CS for 6m, plus LTβR-Ig fusion protein or control Ig (80 μg i.p., weekly) therapeutically from 4 to 6m, and analysed at 6m. k, mRNA expression levels of Cxcl13 and Ccl19 determined by qPCR in whole lung from B6 mice exposed to FA or CS for 4 and 6m, plus LTβR-Ig fusion or control Ig (80 μg i.p., weekly) prophylactically from 2 to 4m and analysed at 4m, and therapeutically from 4 to 6m and analysed at 6m (n=4 mice/group, repeated twice, pooled data shown). P values indicated, Mann-Whitney one-sided test (a-b), unpaired two-tailed Student’s t test (f, h), one-way ANOVA multiple comparisons Bonferroni test (k).

