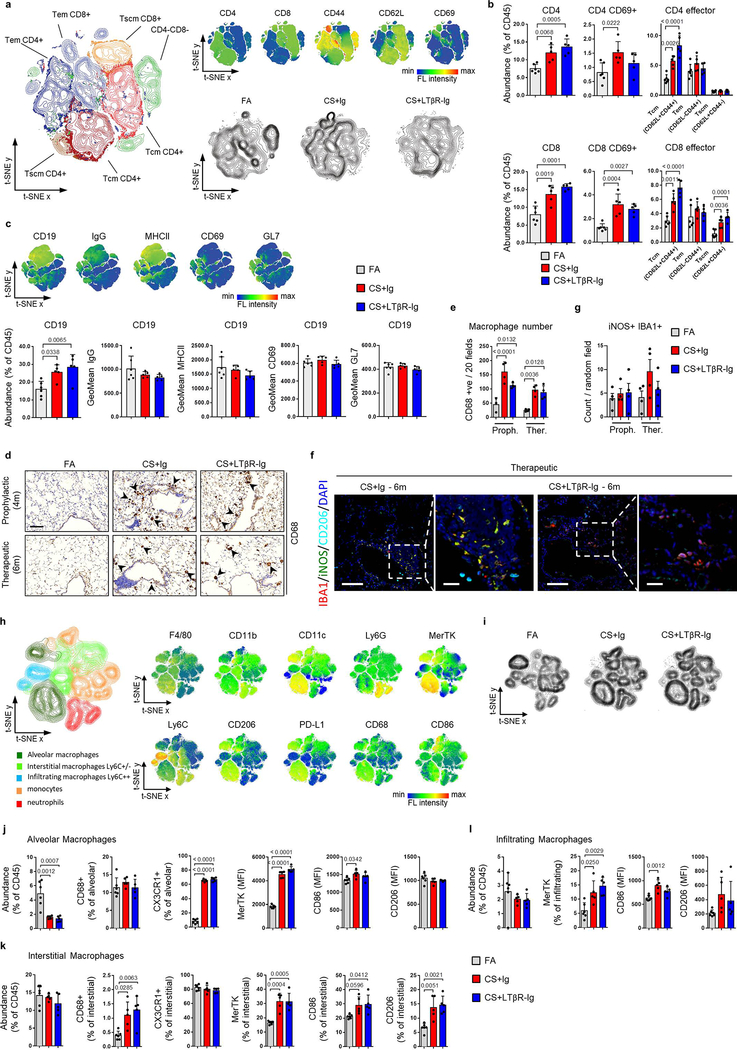
Extended Data Fig. 2. Immune response in lungs of CS-exposed mice treated with LTβR-Ig.
a-c, Flow cytometry analysis of single cell suspensions for adaptive immune cells from whole lung of B6 mice exposed to FA (n=6) or CS for 6m, plus LTβR-Ig fusion (n=5) or control Ig (n=5) (80 μg i.p., weekly) from 4 to 6m and analysed at 6m. a, t-SNE plots showing the distribution and composition of CD4 and CD8 T cells as Tcm (CD62L+CD44+), Tem (CD62L−CD44+) and Tscm (CD62L+CD44−) (left) and t-SNE plots showing the distribution of the surface markers indicated (upper right) and global changes in composition with treatment (lower right). b, Abundance of the T cell populations indicated as a percentage of total CD45+ cells. c, Upper are t-SNE plots showing the distribution of CD19, IgG, MHCII, CD69 and GL7 positive cells, while lower is the abundance of CD19+ B cells as a percentage of total CD45+ cells and the geometric mean fluorescence intensity of the expressed markers indicated on CD19+ B cells. d-g, B6 mice were exposed to FA or CS for 4 and 6m, plus LTβR-Ig fusion protein or control Ig (80 μg i.p., weekly) prophylactically (Proph.) from 2 to 4m and analysed at 4 months and therapeutically (Ther.) from 4 to 6 months, and analysed at 6m. d, Representative images of immunohistochemical analysis for CD68 macrophages in lung sections from the mice (n=4 mice/group, brown signal indicated by arrow heads, haematoxylin counter stained, scale bar 100μm). e, Quantification of CD68 positive macrophages across 20 random fields of view from lung sections stained in (d) (n=4 mice/group). f, Representative low and high magnification overlay images of Multiplex immunofluorescence staining to identify IBA1 (Red), iNOS (Green), CD206 (Turquoise) and DAPI (blue) counterstained lung sections from mice at 6m (Scale bars 100μm and 25μm respectively, n=4 mice/group). g, iNOS and IBA1 double positive macrophages from Multiplex immunofluorescence staining on lung sections from mice treated both prophylactically and therapeutically was quantified using Ilastik and CellProfiler (n=4 mice/group). h-l, Flow cytometry analysis of single cell suspensions for myeloid cells from whole lung of B6 mice exposed to FA (n=6) or CS for 6m, plus LTβR-Ig fusion (n=5) or control Ig (n=5) (80 μg i.p., weekly) from 4 to 6m and analysed at 6m. h, t-SNE plots showing the distribution and composition of myeloid cells and surface markers indicated. i, t-SNE plots showing global changes in composition with treatment. j, Composition of CD45+Ly6g−F480+CD11c+ alveolar macrophages. k, Composition of CD45+Ly6g−F480+CD11c−CD11b+ interstitial macrophages. l, Composition of CD45+Ly6g−F480+CD11c−CD11b+Ly6chigh infiltrating macrophages. Data shown mean ± SD, P values indicated, one-way ANOVA multiple comparisons Bonferroni test (b, c, e, g, j-l).

